
Gold showed a downtrend movement for the last 10 days. However, a corrective bounce followed yesterday. A bullish crossover took place yesterday but is starting to flatten, hinting at slowing momentum during Friday’s trading.
Price is currently testing short term moving averages MA(5), and MA(10) with a dynamic support of moving average MA(30) around $3,200 levels.
RSI hit a high near 65 in early trading today and is now turning downwards, suggesting a possible loss of bullish momentum. If RSI breaks below 50, it could signal more downside movement.
The focus is now on the psychological level of $3,250. If price remains under this level, more declines are expected on the precious metal.
Gold (XAUUSD) 1H Chart
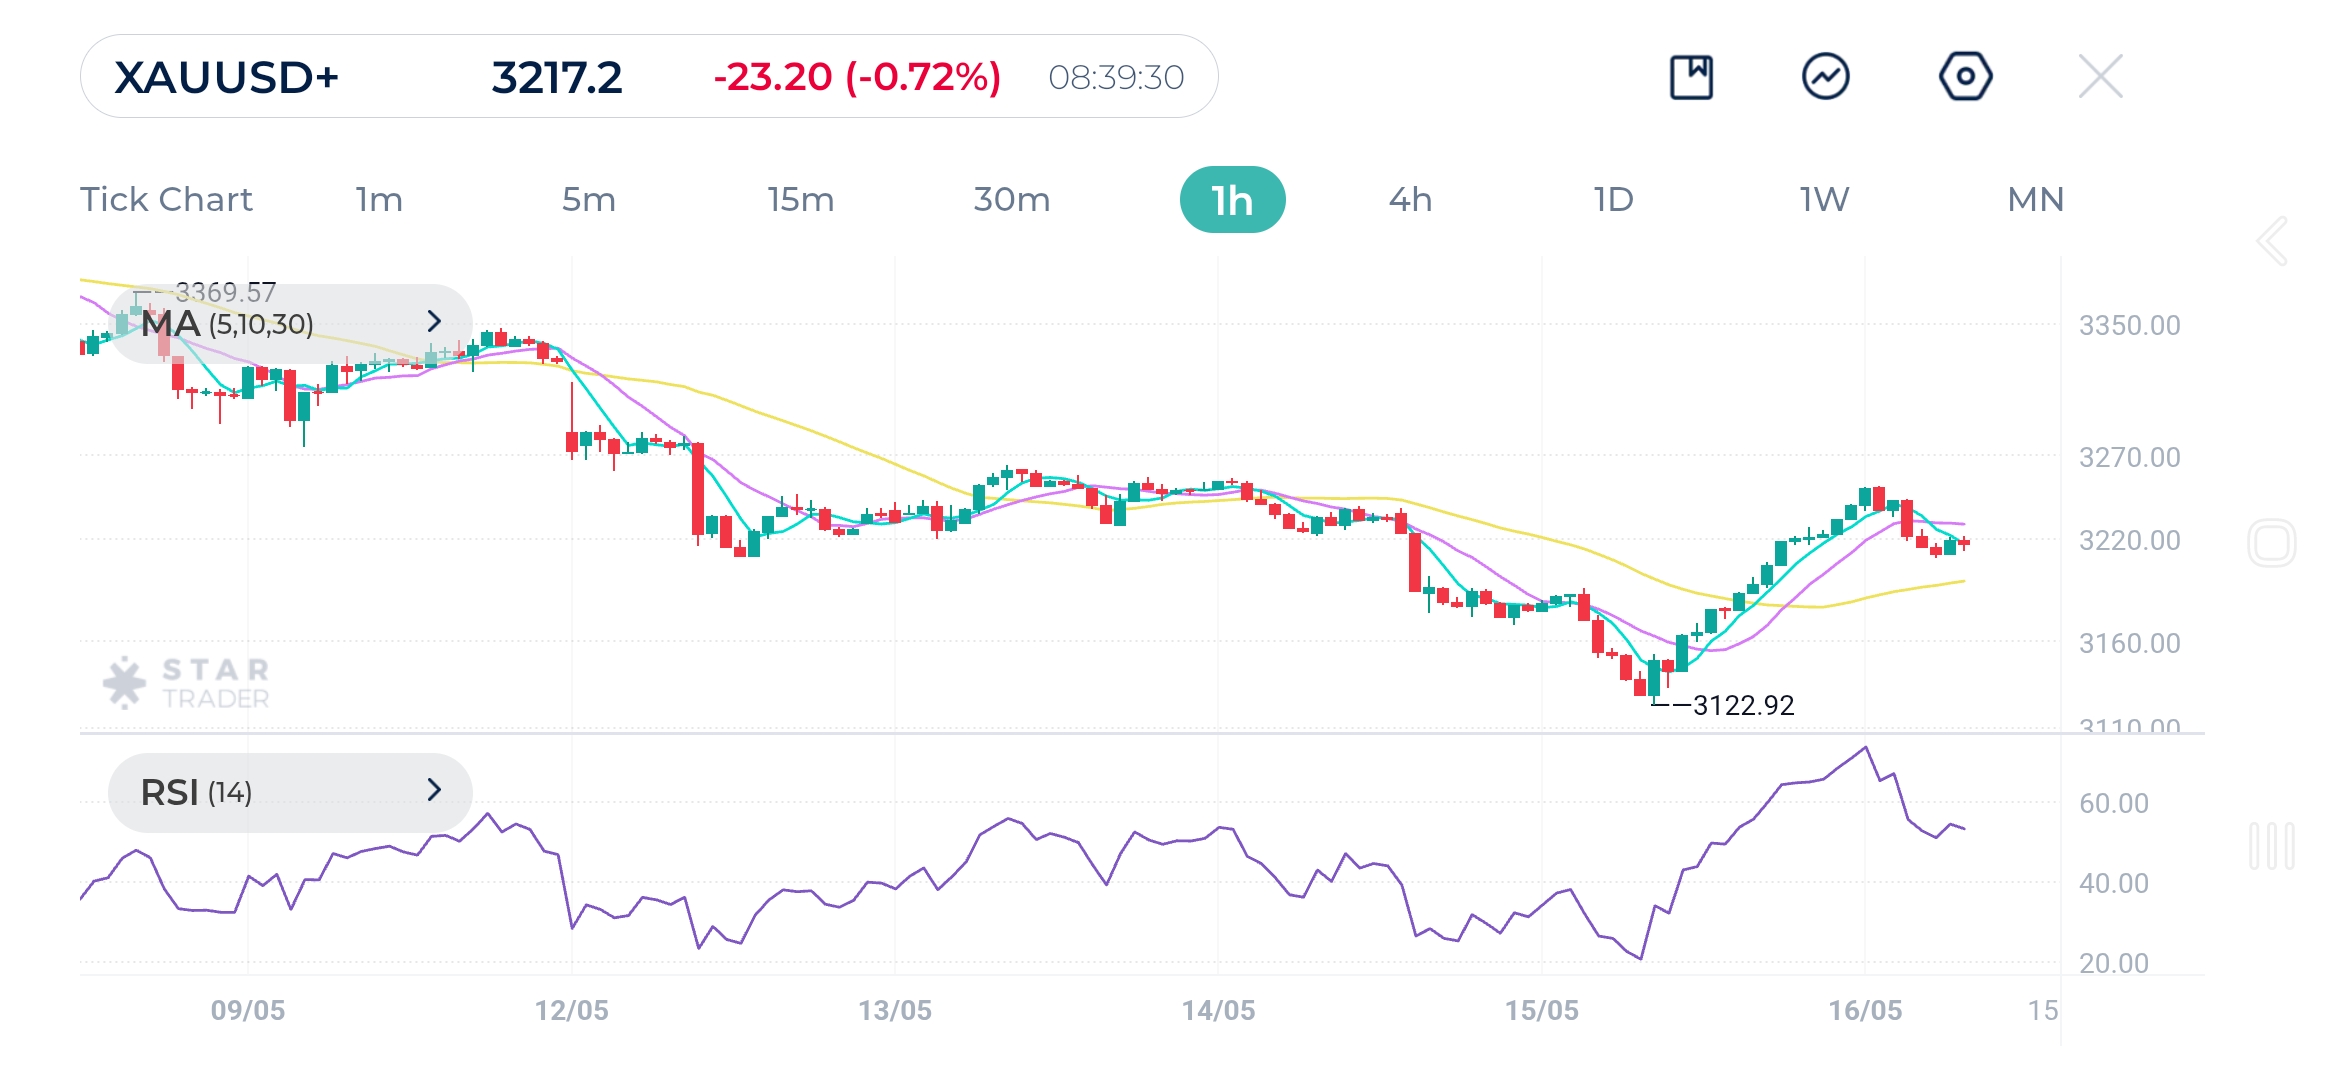
| Resistance | $3,244 | $3,259 | $3,282 |
| Support | $3,206 | $3,190 | $3,153 |
The overall trend on the EURUSD pair has been in a mild consolidation for the past few days. Price is trying to stabilize above 1.1200.
A bullish crossover occurred as the moving average MA(5) and MA(10) moved above the MA(30) around initiating a short-term uptrend However, all three moving averages are currently close and mostly moving flat, indicating a consolidation phase.
Candlesticks show indecisiveness. RSI is hovering around 55, suggesting very moderate bullish momentum. No clear overbought/oversold signals on the indicator. Prices could continue sideways unless RSI crosses 70 or drops below 40.
Watch for a breakout above 1.1260 to confirm further bullish movement. A drop below the recent consolidation could signal another retest of the 1.1150–1.1100 zone.
EURUSD 1H Chart
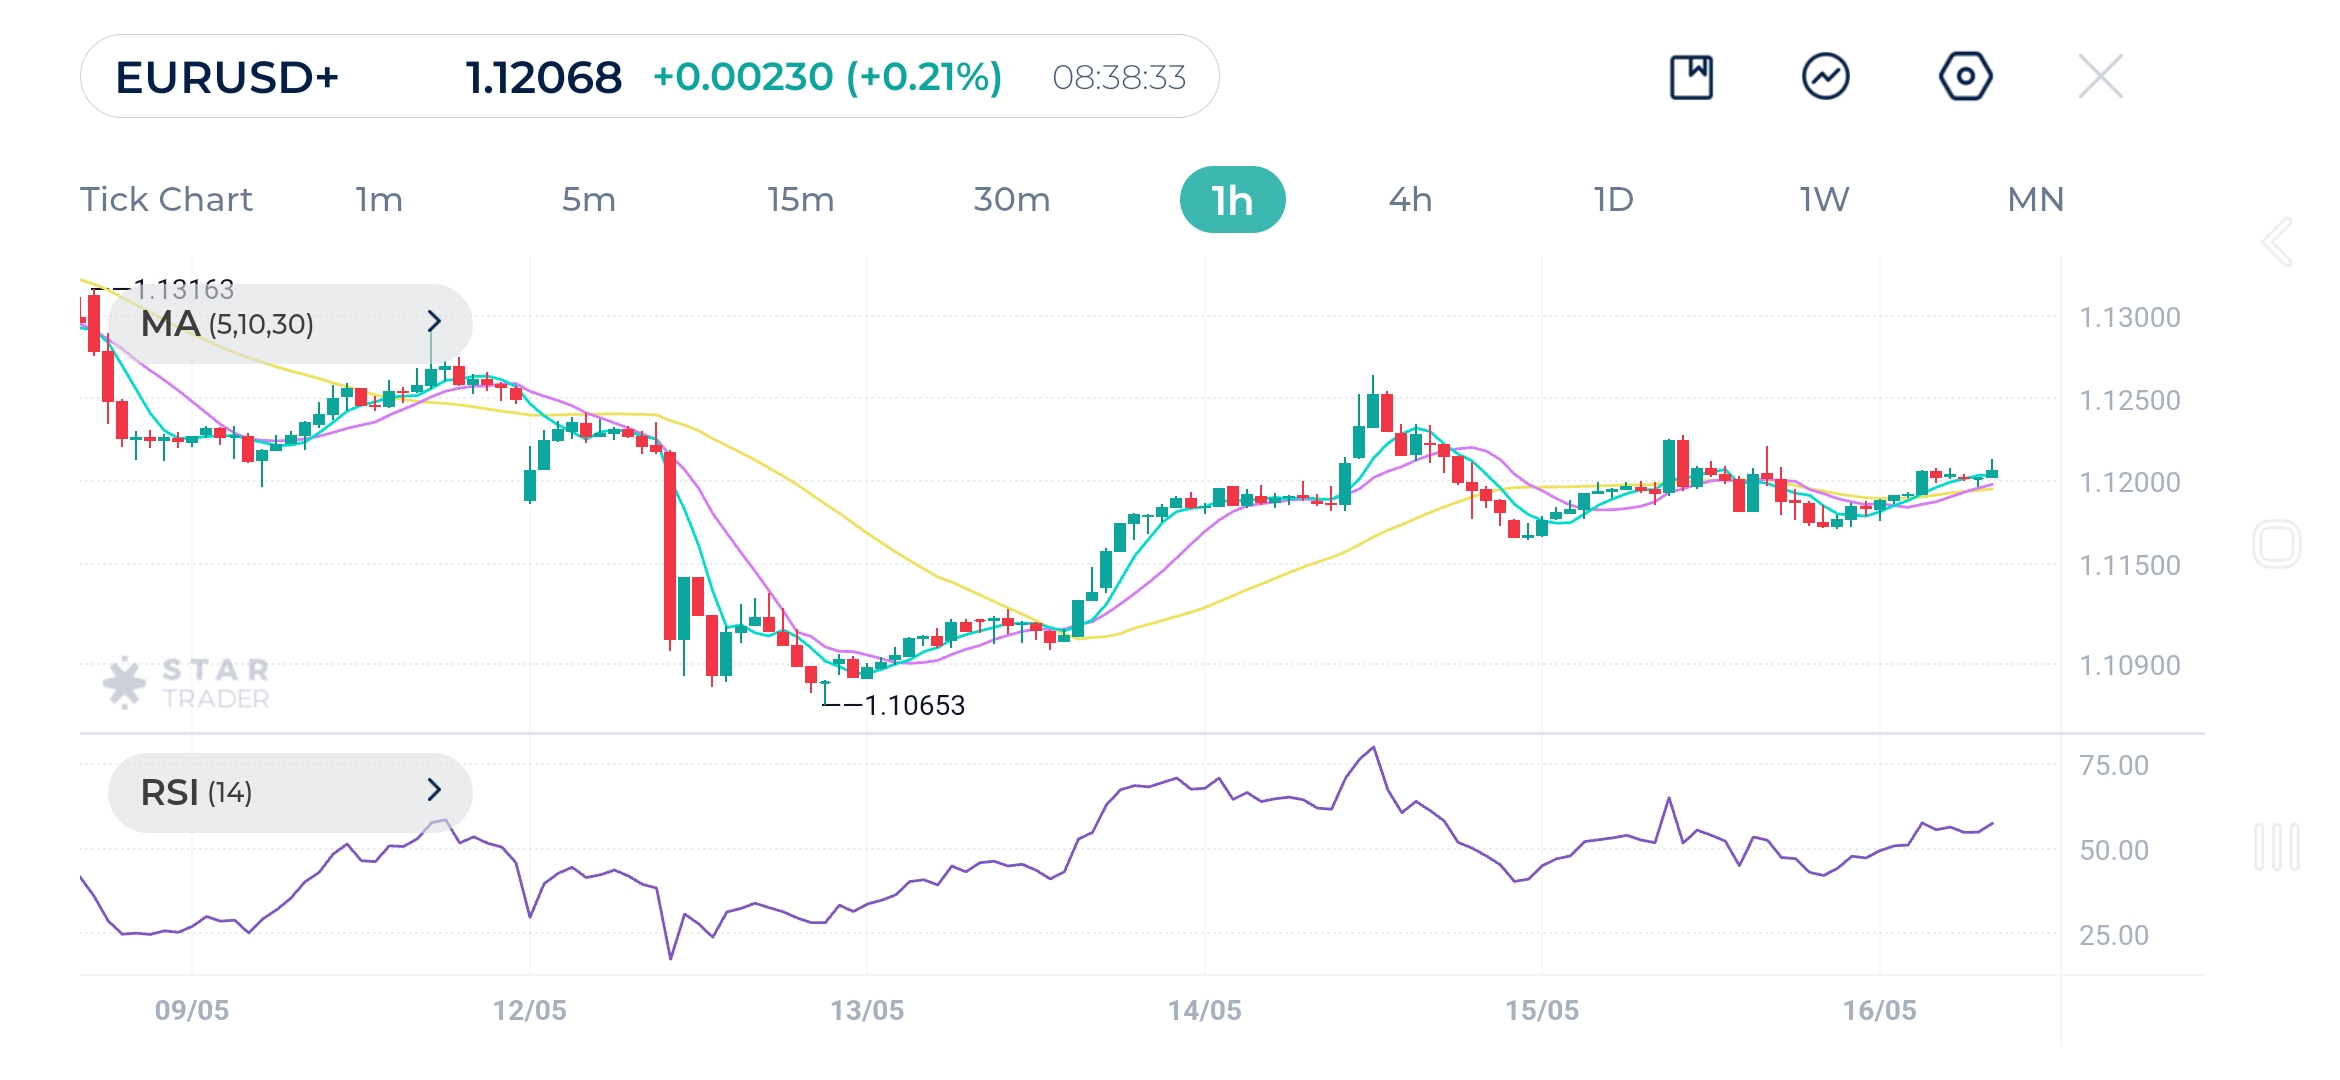
| Resistance | 1.1229 | 1.1264 | 1.1293 |
| Support | 1.1170 | 1.1130 | 1.1096 |
Bitcocin shows a choppy trend overall, with recent bullish momentum pushing price from $101,800 to above $104,000. A strong bullish crossover occurred yesterday with moving averages MA(5) and MA(10) breaking above MA(30), which brought bitcoin closer to the $105,000 levels. Currently, short-term and mid-term moving averages are stacked bullishly supporting continuation upwards.
RSI peaked above 60 and is currently retracing slightly, still holding above 50—suggesting continued buying interest with no bearish divergence observed.:
As long as prices hold above the $103,000 level and all three moving averages, buyers remain in control. A push above $105,800 would target $107,000 next.
Bitcoin (BTCUSD) 1H Chart
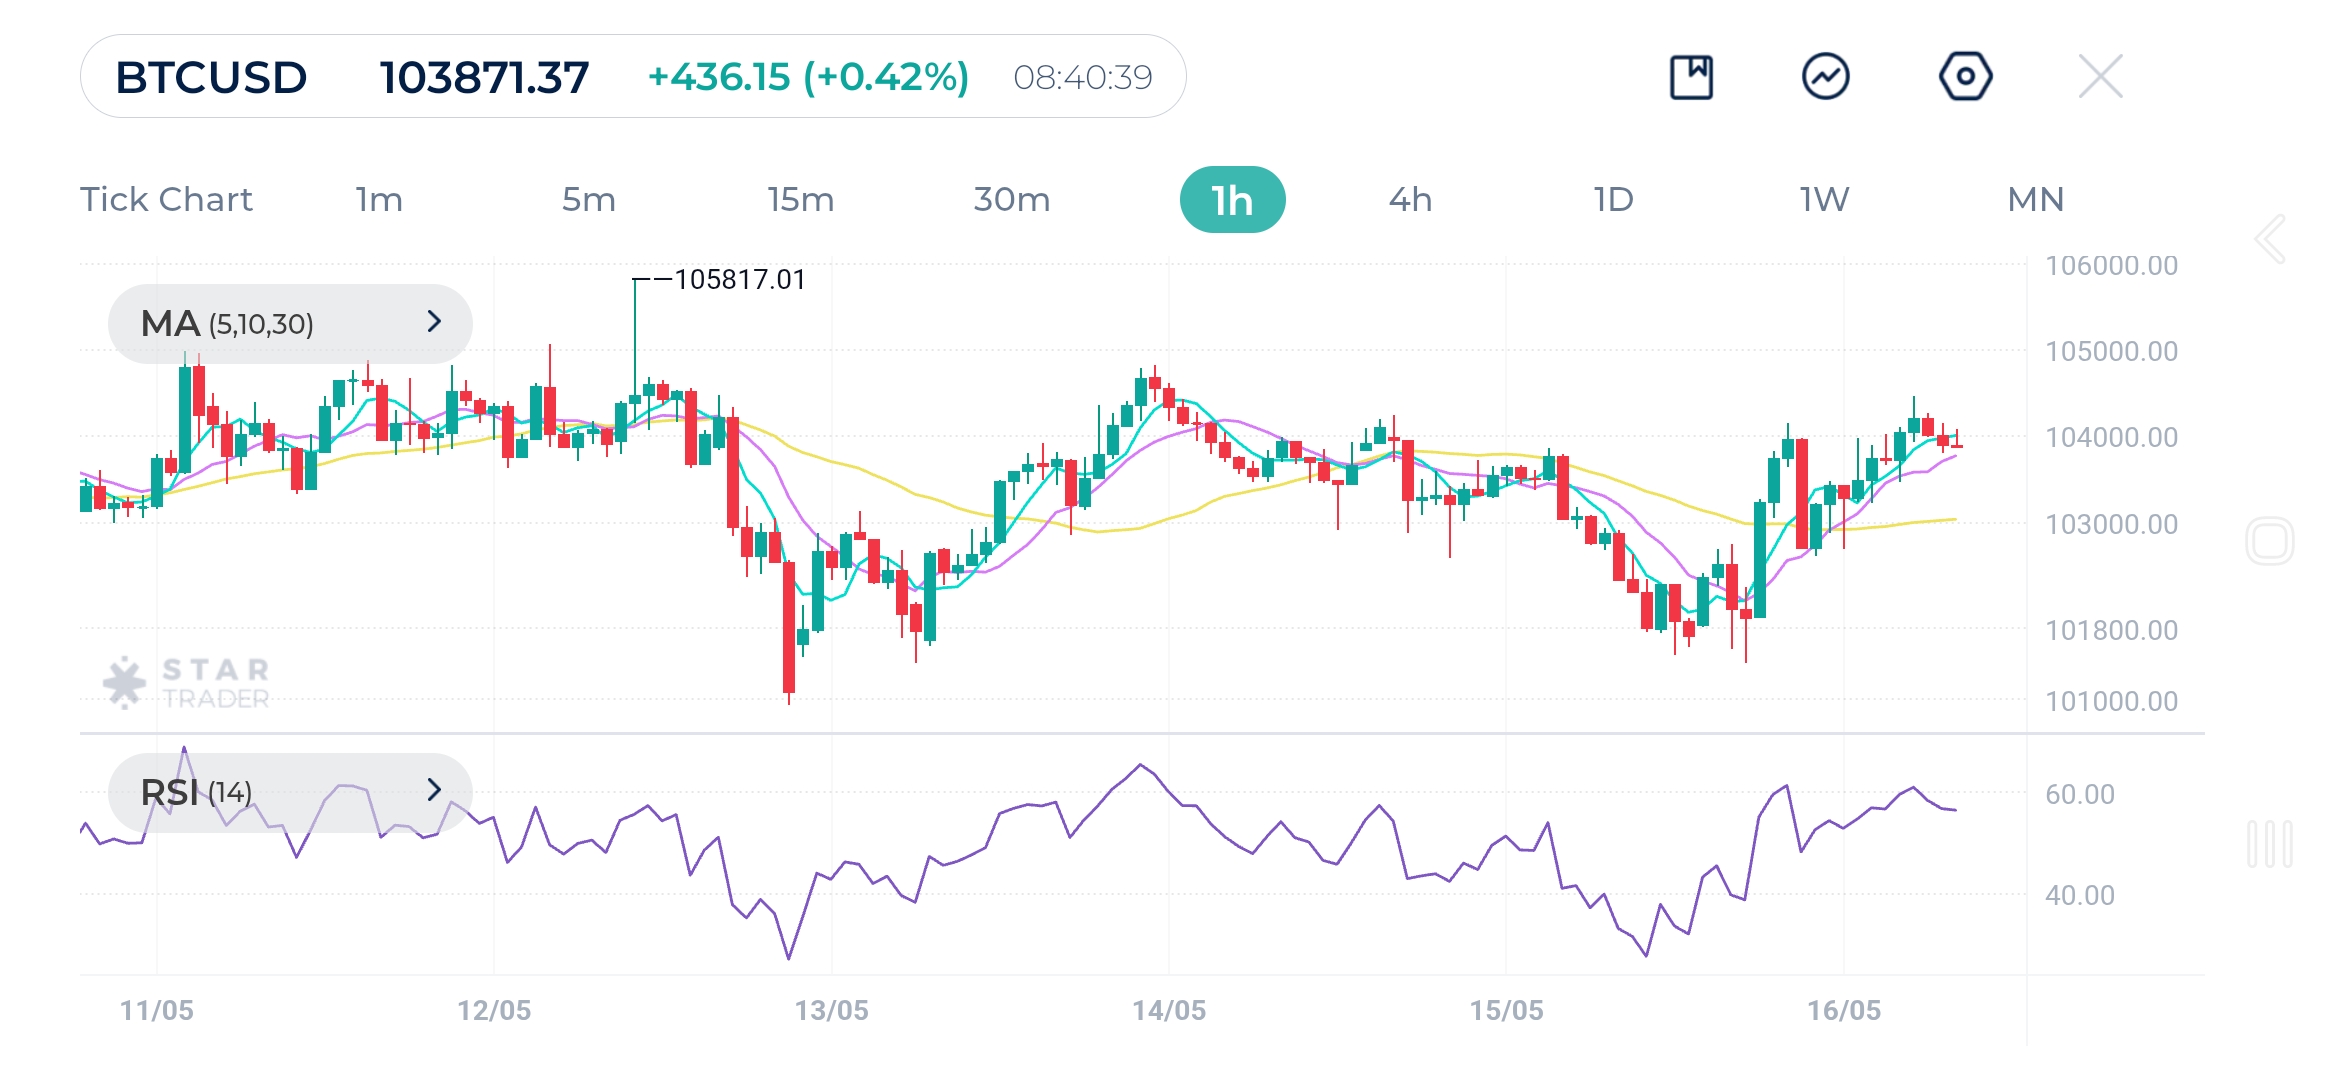
| Resistance | $105,014 | $105,816 | $106,72 |
| Support | $103,484 | $102,750 | $101,94 |
Tags
Open Live Account
Please enter a valid country
No results found
No results found
Please enter a valid email
Please enter a valid verification code
1. 8-16 characters + numbers (0-9) 2. blend of letters (A-Z, a-z) 3. special characters (e.g, !a#S%^&)
Please enter the correct format
Please tick the checkbox to proceed
Please tick the checkbox to proceed
Important Notice
STARTRADER does not accept any applications from Australian residents.
To comply with regulatory requirements, clicking the button will redirect you to the STARTRADER website operated by STARTRADER PRIME GLOBAL PTY LTD (ABN 65 156 005 668), an authorized Australian Financial Services Licence holder (AFSL no. 421210) regulated by the Australian Securities and Investments Commission.
CONTINUEImportant Notice for Residents of the United Arab Emirates
In alignment with local regulatory requirements, individuals residing in the United Arab Emirates are requested to proceed via our dedicated regional platform at startrader.ae, which is operated by STARTRADER Global Financial Consultation & Financial Analysis L.L.C.. This entity is licensed by the UAE Securities and Commodities Authority (SCA) under License No. 20200000241, and is authorised to introduce financial services and promote financial products in the UAE.
Please click the "Continue" button below to be redirected.
CONTINUEError! Please try again.