USDJPY rebounds, but fails to maintain 145.00 levels
USDJPY has been in a downtrend since 10 January of this year, evident by the lower highs on the daily chart. The pair broke the uptrend earlier this month, but failed to stay above the broken trend and continued to fall. The overall sentiment is still bearish on the dollar against the Japanese Yen. A daily close below 142.00 confirms the downtrend momentum.
Price is hovering around these short-term moving averages (MA 5, 10, 30) showing indecision in the market.
MACD shows weak momentum. The MACD line is slightly bearish suggesting consolidation or early stages of a bearish move. A correction towards 145.00 level is possible before continuing with the downtrend.
USDJPY Daily Chart
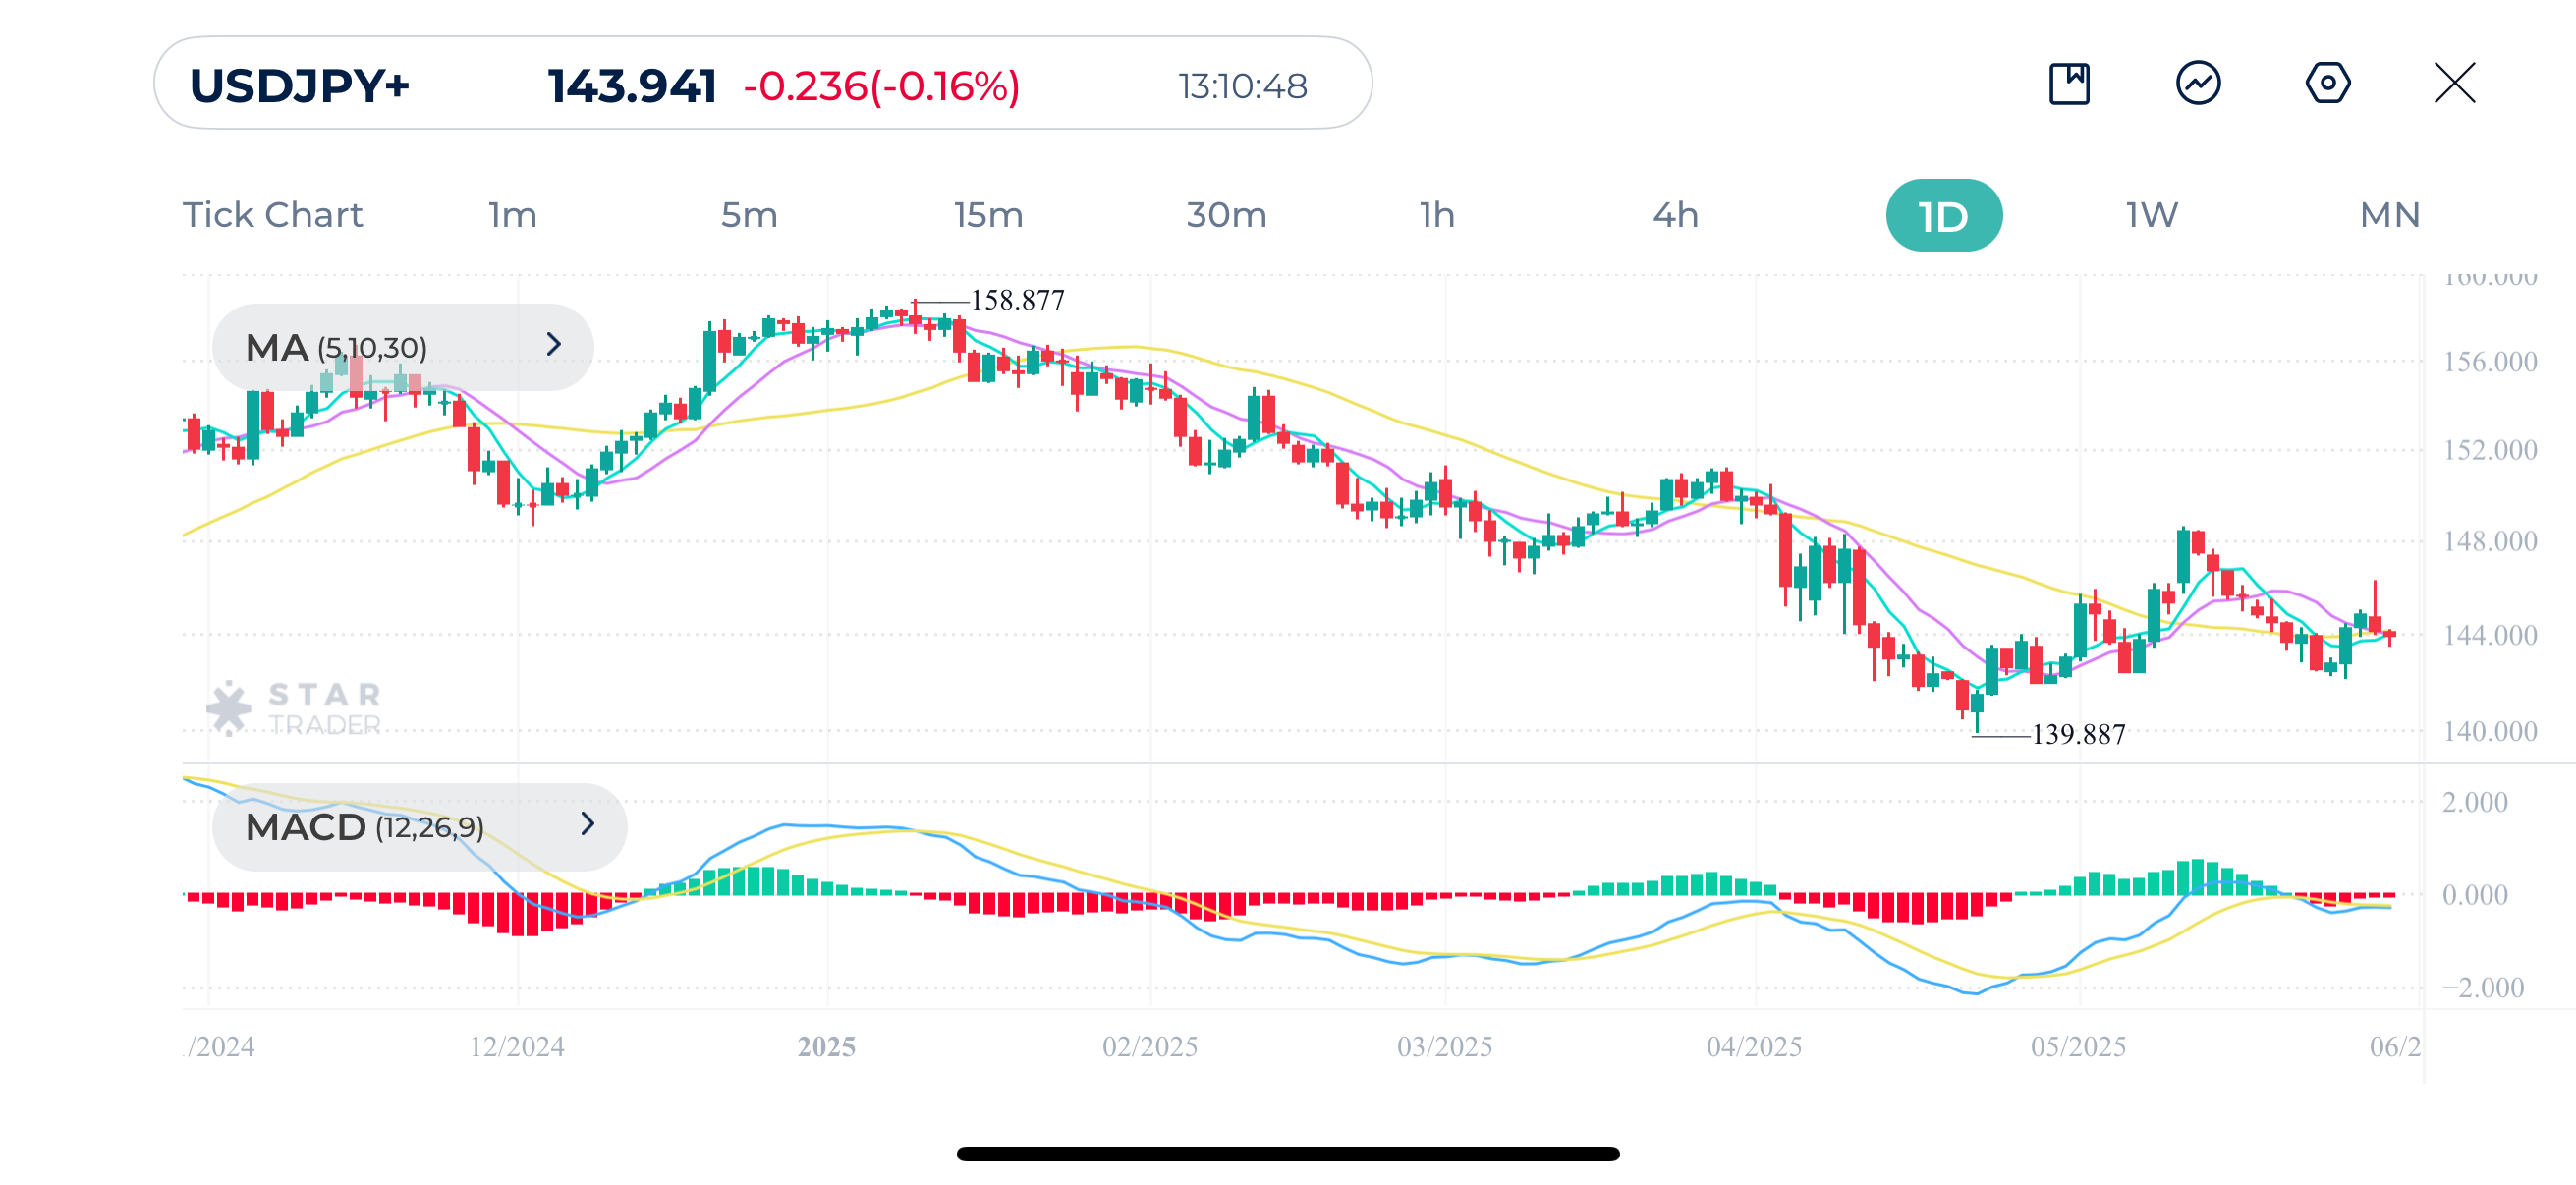
| Resistance | 144.73 | 145.43 | 146.25 |
| Support | 142.13 | 141.56 | 139.88 |
Bitcoin breaks a new record before experiencing a bearish correction.
Bitcoin shows a strong bullish momentum as the uptrend remains intact since April around $75,000. The crypto currency is experiencing a slight retracement from the historical level of $112,000.
Price is moving above the moving average MA(30), keeping the bullish structure strong. A bearish crossover on MA(5) and MA(10) indicates a potential decline towards $103,420 levels. It’s important to monitor price action and candlestick patterns as price touches the moving average MA(30). Failing to close below this dynamic support could open the door for more gains.
Bitcoin is still bullish overall, but the recent loss of momentum could lead to a deeper pullback toward $100,000 or even $95,000, especially if MACD weakness continues and volume remains low. Key support to watch lies around the $100,000 psychological level.
Bitcoin (BTCUSD) Daily Chart
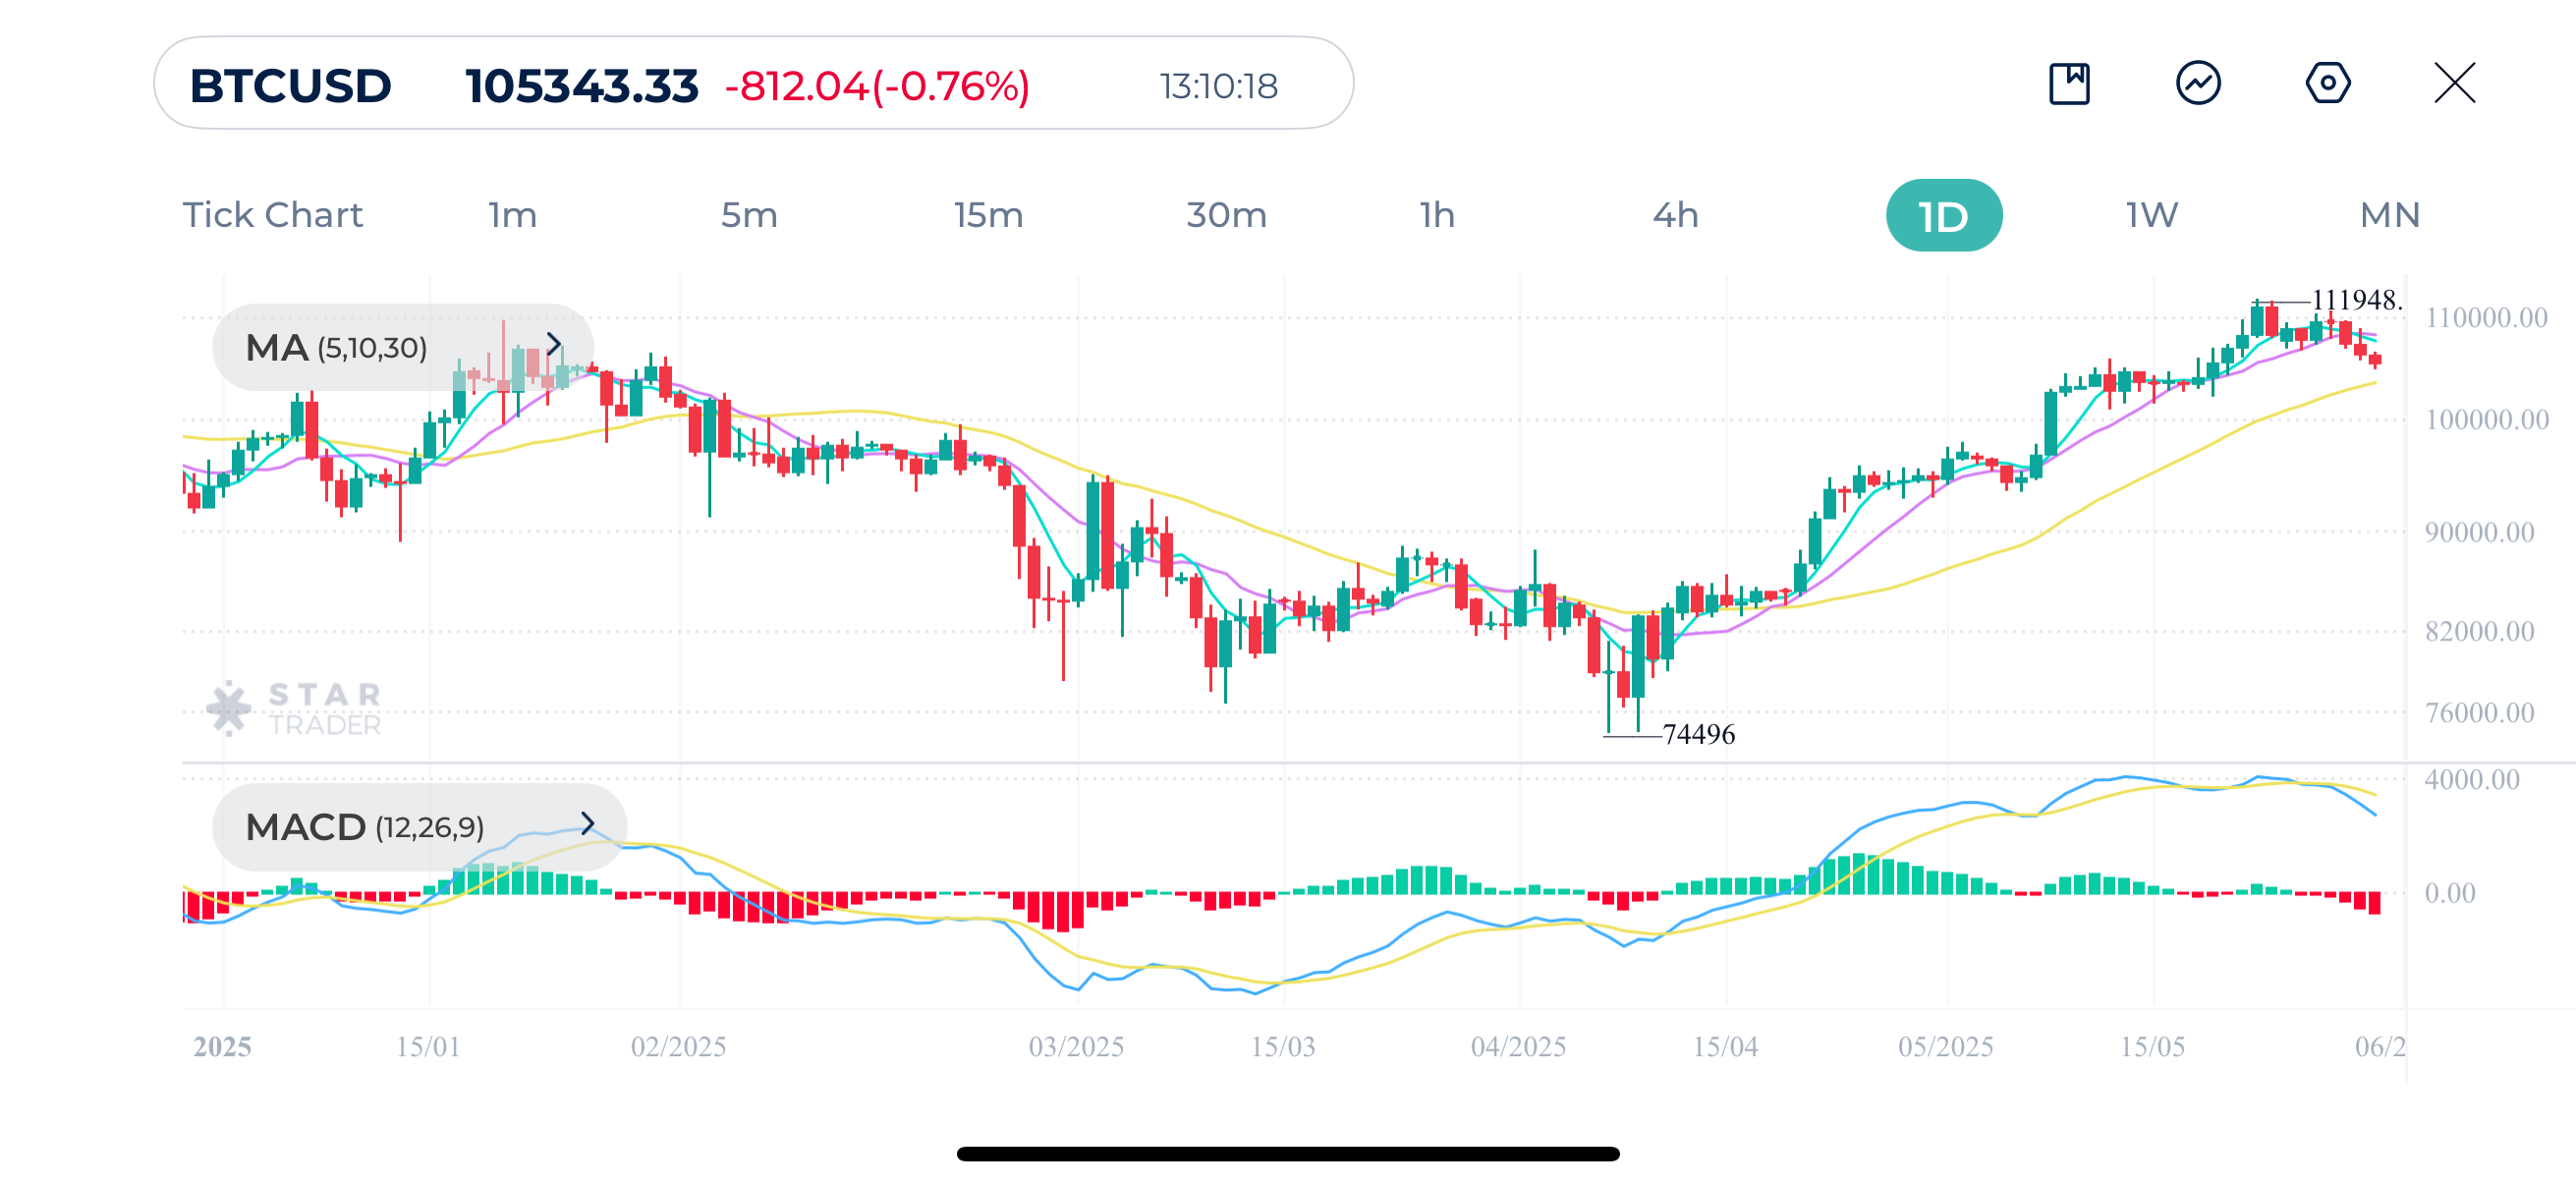
| Resistance | $109,094 | $100,950 | $112,030 |
| Support | $102,218 | $100,630 | $97,961 |
Gold prices continue to fluctuate around the $3,300 level with no clear bias in the short term. Short term moving averages MA(5), MA(10) and mid-term moving averages Ma(30) show no clear indication on a specific trend. The focus turns to the near support and resistance levels on the daily chart.
Falling below $3,250 could result in more declines towards $3,120. A daily close above $3,369 opens the door for more upward movement towards $3,437
Gold Daily Chart
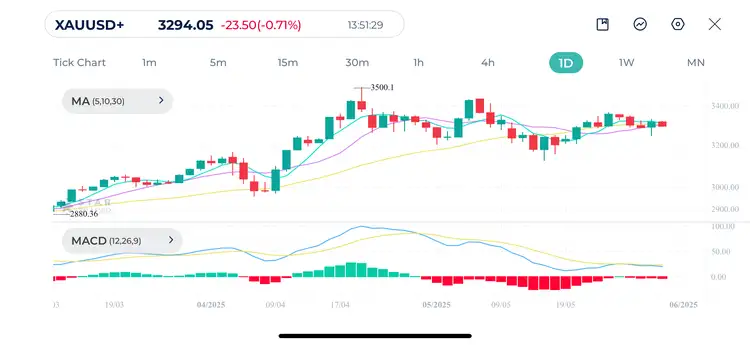
| Resistance | $3,367 | $3,433 | $3,468 |
| Support | $3,248 | $3,207 | $3,120 |
Tags
Open Live Account
Please enter a valid country
No results found
No results found
Please enter a valid email
Please enter a valid verification code
1. 8-16 characters + numbers (0-9) 2. blend of letters (A-Z, a-z) 3. special characters (e.g, !a#S%^&)
Please enter the correct format
Please tick the checkbox to proceed
Please tick the checkbox to proceed
Important Notice
STARTRADER does not accept any applications from Australian residents.
To comply with regulatory requirements, clicking the button will redirect you to the STARTRADER website operated by STARTRADER PRIME GLOBAL PTY LTD (ABN 65 156 005 668), an authorized Australian Financial Services Licence holder (AFSL no. 421210) regulated by the Australian Securities and Investments Commission.
CONTINUEImportant Notice for Residents of the United Arab Emirates
In alignment with local regulatory requirements, individuals residing in the United Arab Emirates are requested to proceed via our dedicated regional platform at startrader.ae, which is operated by STARTRADER Global Financial Consultation & Financial Analysis L.L.C.. This entity is licensed by the UAE Securities and Commodities Authority (SCA) under License No. 20200000241, and is authorised to introduce financial services and promote financial products in the UAE.
Please click the "Continue" button below to be redirected.
CONTINUEError! Please try again.