
EURUSD rebounds and reaches highest level in a month, Gold breaks above $3,350
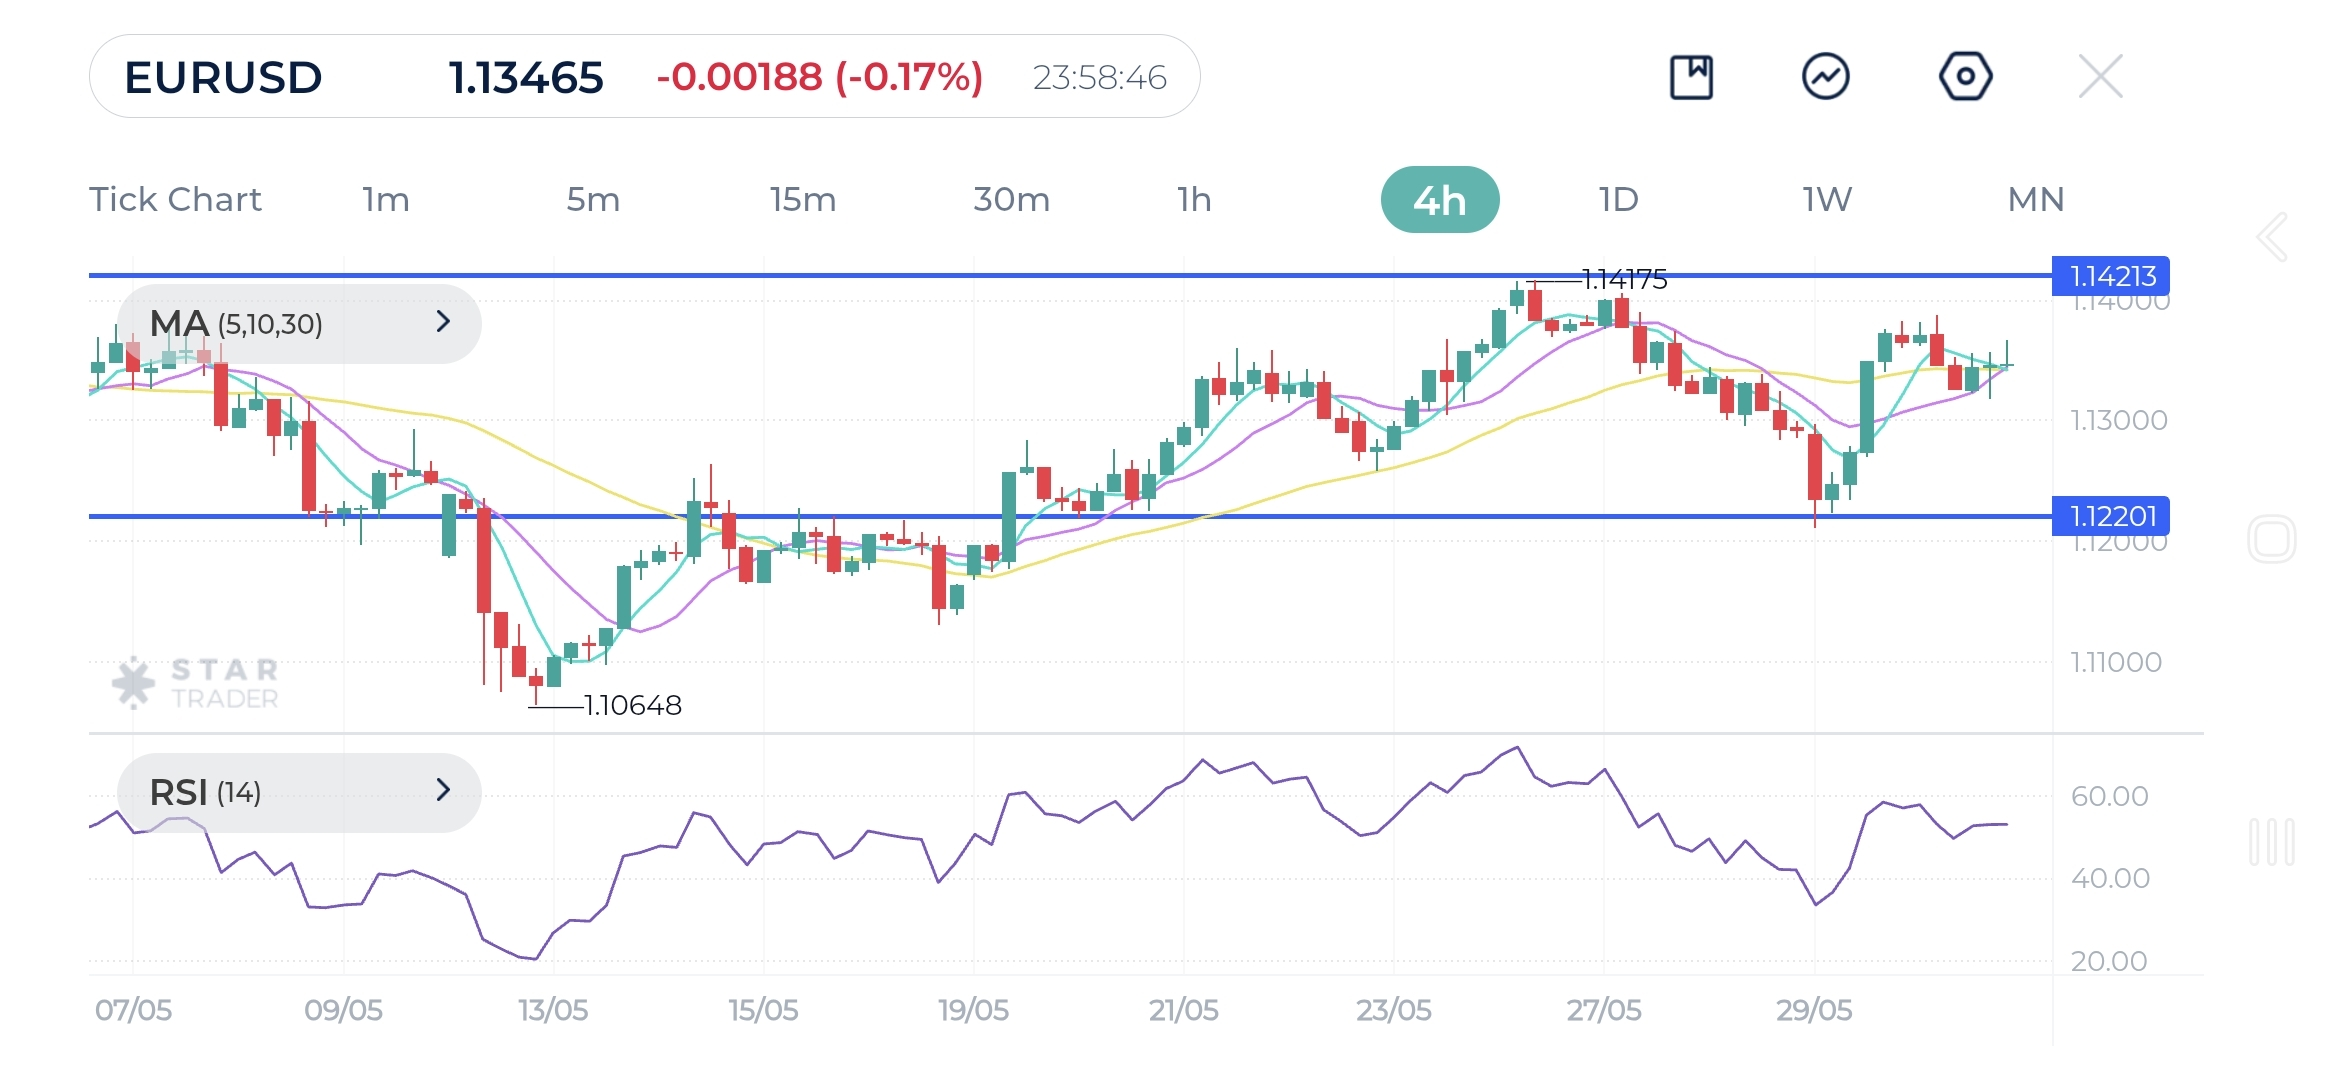
The EUR/USD 4-hour chart reveals a firm rebound from the 1.1220 support, suggesting the formation of a short-term bottom. While the pair is still in a consolidation mode, it continues to trade near its 30-day SMA, preserving most of its gains from the medium-term perspective. Immediate resistance lies at 1.1420, where a confirmed breakout could pave the way for further upside toward the supply area between the psychological level of 1.1500 and the previous peak of 1.1560. On the downside, a deeper retracement would force short-term buyers out and expose May’s low at 1.1070. The RSI hovering around the 50 mark reflects a cautiously bullish sentiment, with the potential for continued gains if support levels hold.
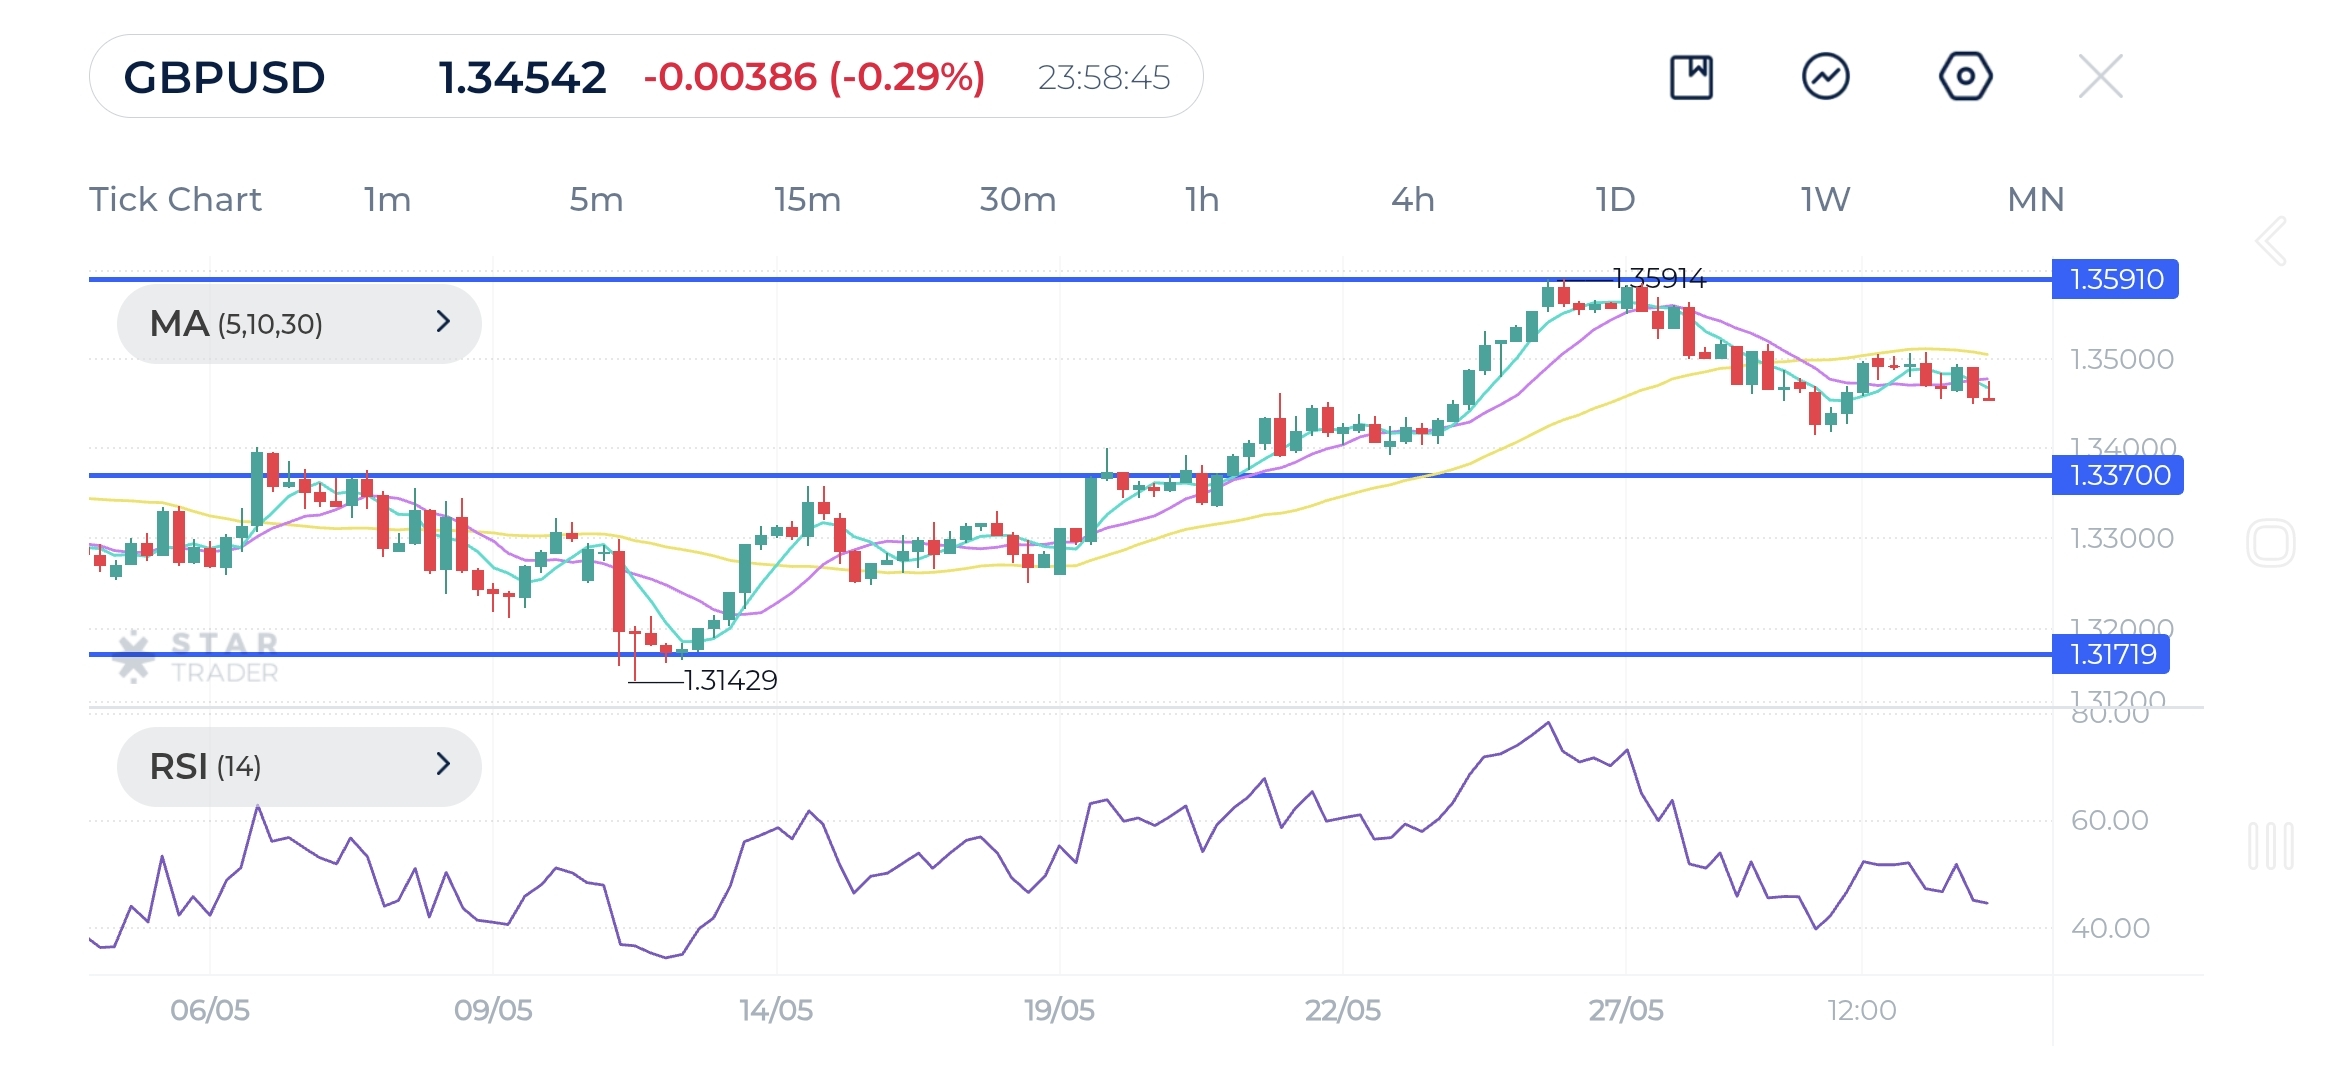
GBP/USD remains technically bullish though with a consolidation bias in the short term after its failure to hold onto the 1.3500 handle. The next support levels for sellers are seen at 1.3370 over the 30-day SMA, followed by 1.3250. Although the pair has bounced off daily lows, a sustained move above 1.3520 would be needed to shift the near-term sentiment. Following a rally from the mid-May lows at 1.3150, the current pullback may represent a temporary pause in the broader uptrend. A break back above the 1.3590 mark could pave the way for a move toward 1.3700, renewing the bullish outlook.
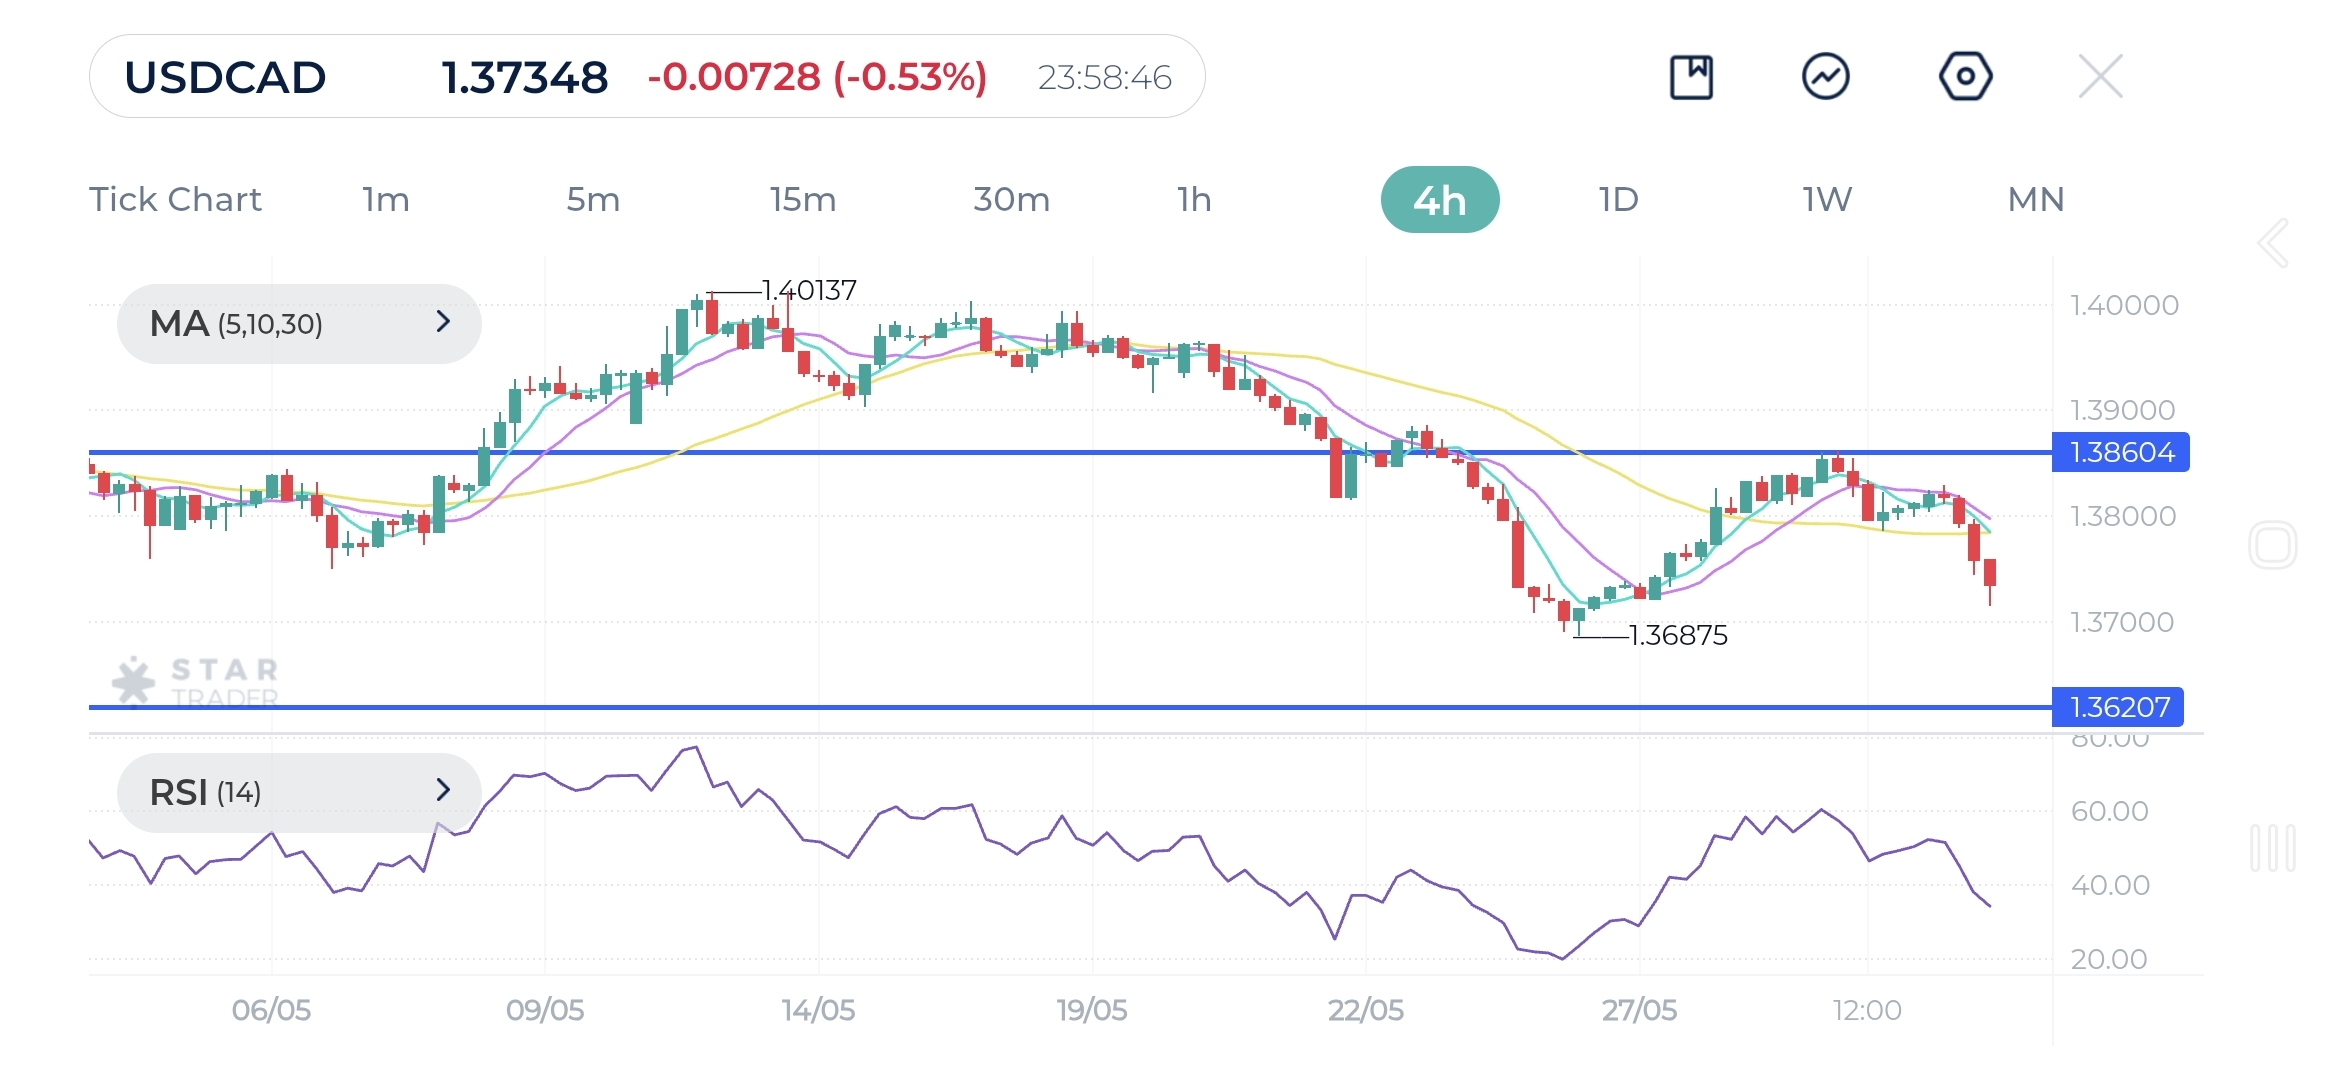
USD/CAD is still displaying a lack of conviction as the broader downtrend from January remains in place. The 30-day SMA at 1.3860 stands as immediate resistance after a failed bounce. As long as the price remains below this mark, the risk of revisiting the recent multi-month lows around 1.3580 is high, with 1.3620 as the first support level. However, a break above the moving average would prompt shorts to cover and strengthen bullish momentum, opening the door toward the lower high at 1.4000. Conservative traders may wait for breakout and momentum confirmation before committing to a bullish reversal.
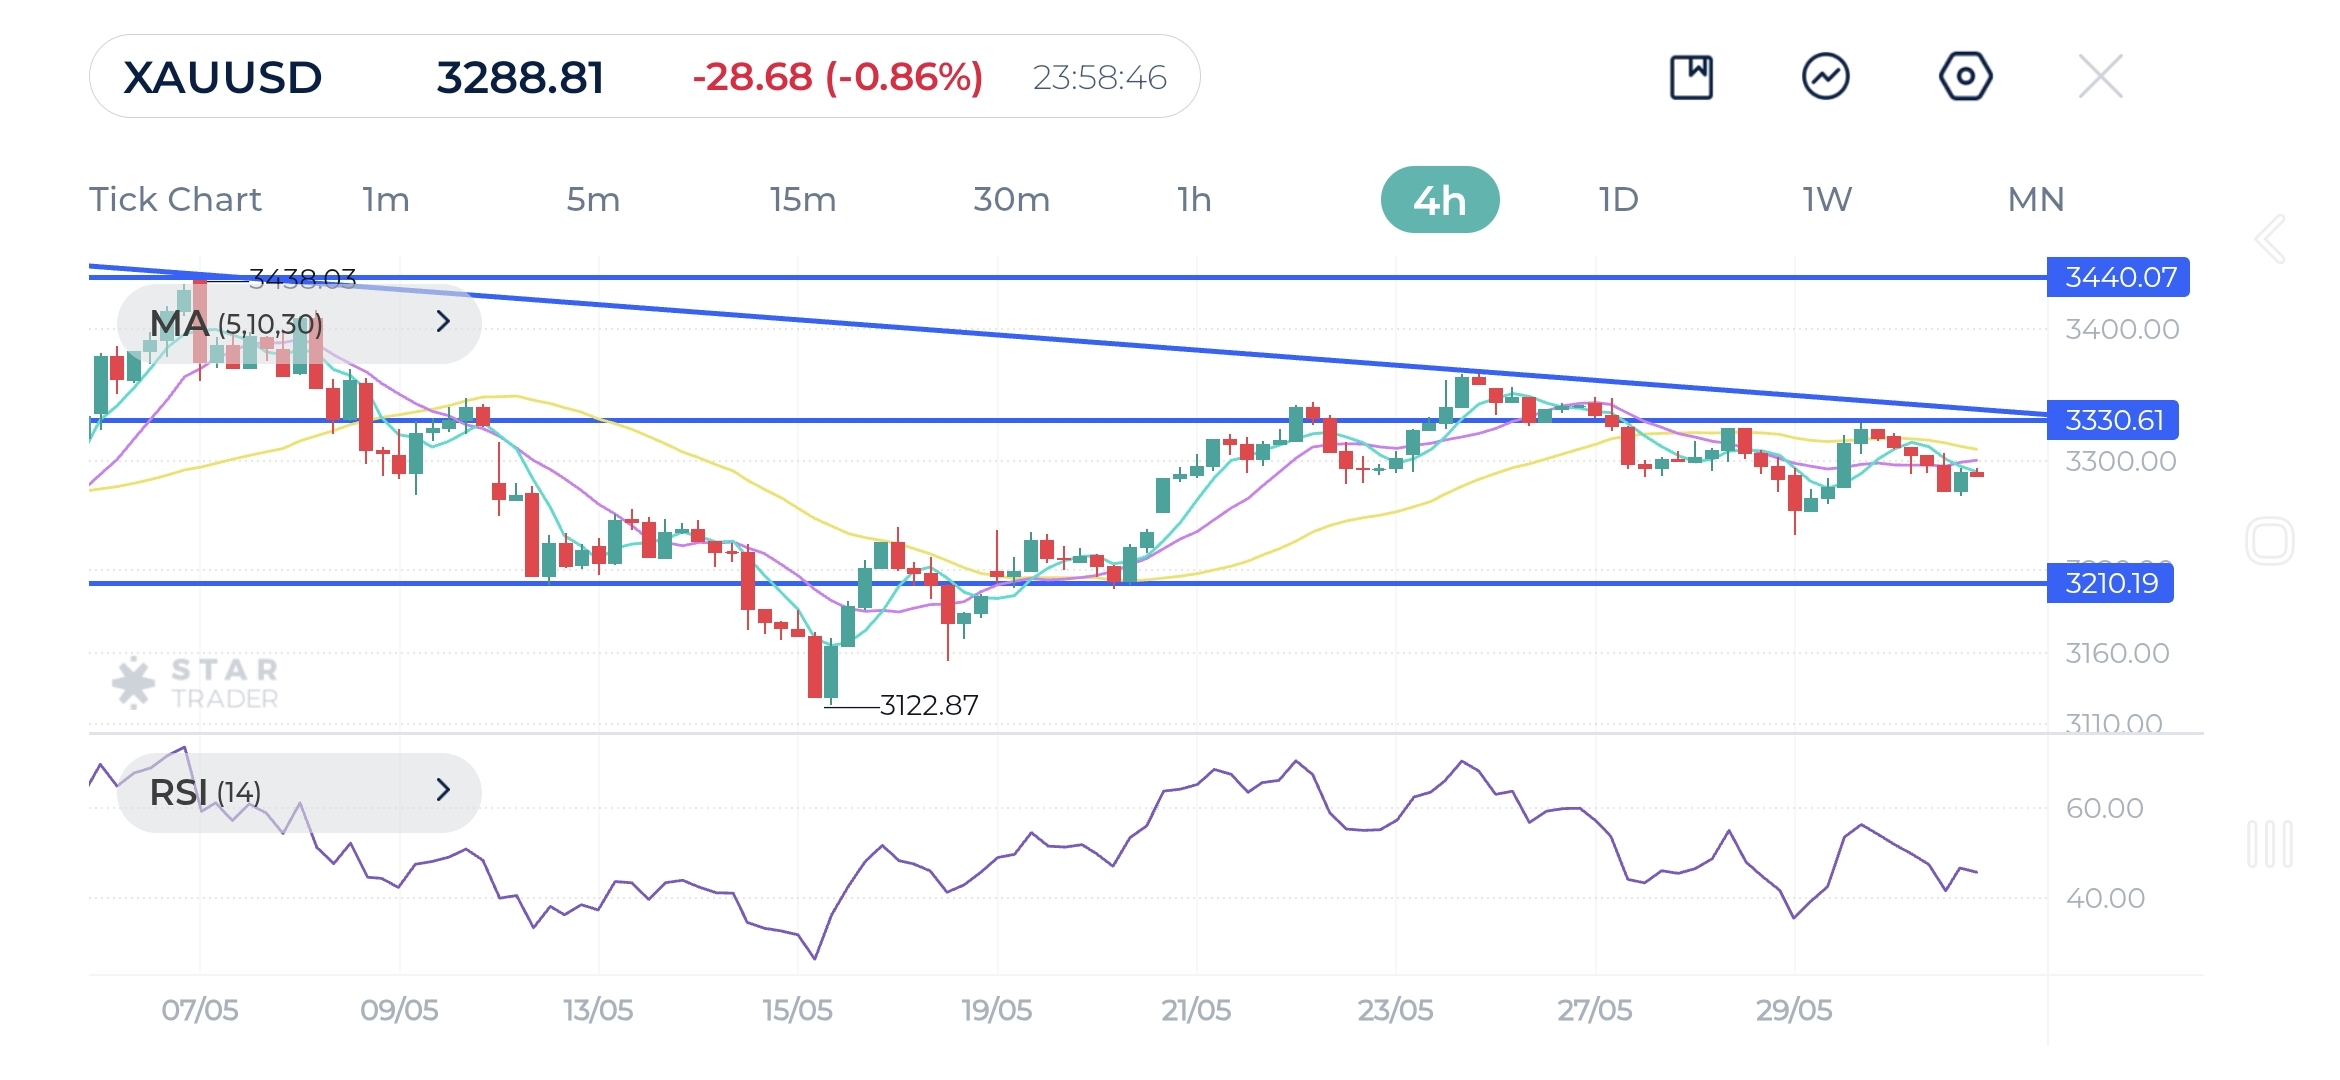
Gold price action shows the metal hovering around the 30-day SMA as the market continues to digest the recent rally. The key support zone rests at 3210 which matches the previous supply area of 3210-3250. A break or close below this threshold would signal extended weakness in the short-term, opening the path toward deeper support levels with the first being 3090. On the upside, 3330 on the downward trendline is a major hurdle, and its breach would point to a possible resumption of the broader uptrend. This would place the May high-close at 3430 and the all-time high at 3500 back in focus. A larger reaction would be expected at those levels if tested, with subsequent technical targets at 3600.
Tags
Open Live Account
Please enter a valid country
No results found
No results found
Please enter a valid email
Please enter a valid verification code
1. 8-16 characters + numbers (0-9) 2. blend of letters (A-Z, a-z) 3. special characters (e.g, !a#S%^&)
Please enter the correct format
Please tick the checkbox to proceed
Please tick the checkbox to proceed
Important Notice
STARTRADER does not accept any applications from Australian residents.
To comply with regulatory requirements, clicking the button will redirect you to the STARTRADER website operated by STARTRADER PRIME GLOBAL PTY LTD (ABN 65 156 005 668), an authorized Australian Financial Services Licence holder (AFSL no. 421210) regulated by the Australian Securities and Investments Commission.
CONTINUEImportant Notice for Residents of the United Arab Emirates
In alignment with local regulatory requirements, individuals residing in the United Arab Emirates are requested to proceed via our dedicated regional platform at startrader.ae, which is operated by STARTRADER Global Financial Consultation & Financial Analysis L.L.C.. This entity is licensed by the UAE Securities and Commodities Authority (SCA) under License No. 20200000241, and is authorised to introduce financial services and promote financial products in the UAE.
Please click the "Continue" button below to be redirected.
CONTINUEError! Please try again.