
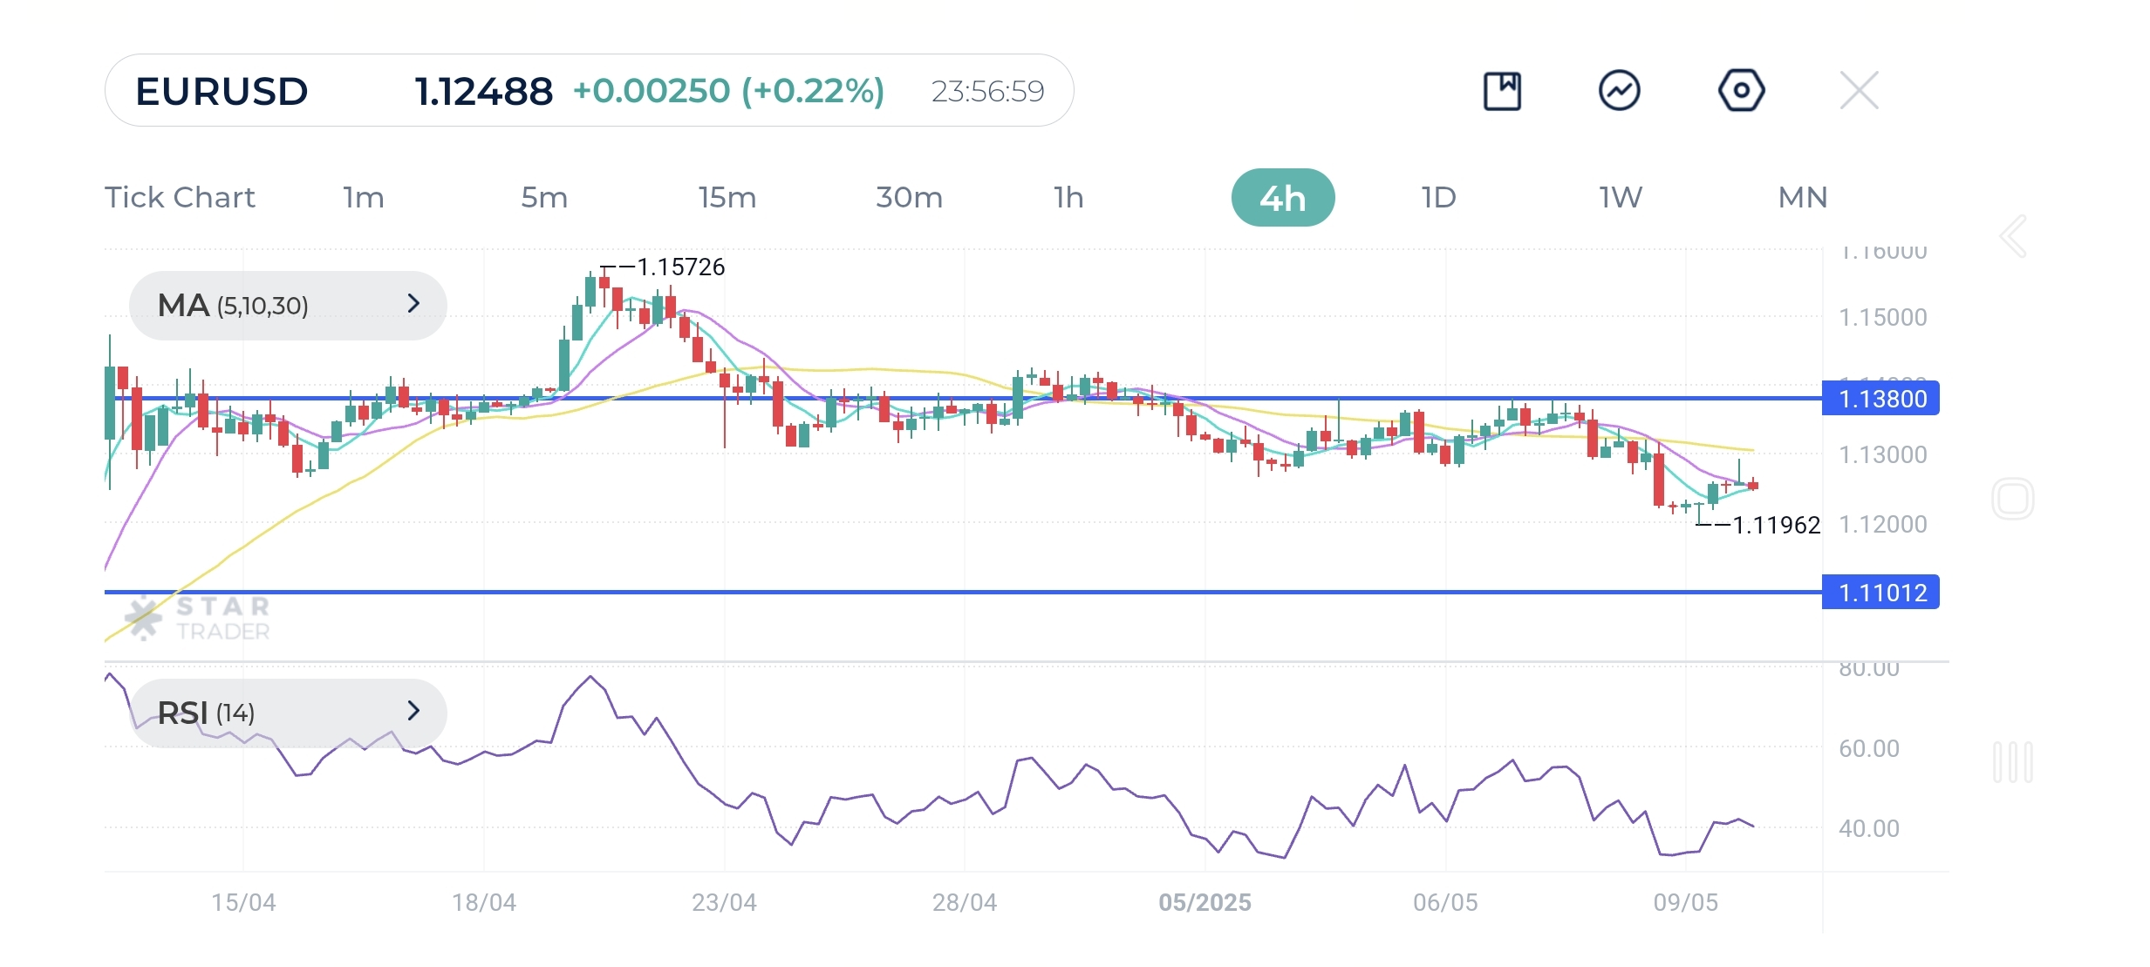
EUR/USD saw a mild bounce from the 1.1200 support level which sits over the 30-day SMA, but may face renewed downside pressure. The RSI has risen from oversold territory, signaling easing bearish momentum, but it remains below the 50 mark, indicating that sellers still have the upper hand. The pair continues to trade below the 30-period SMA, reinforcing the current correction bias on the 4-hour chart. This suggests that any upside moves could remain capped unless bulls regain strength above the SMA and 1.1380. The round number and previous high of 1.1100 could be next if the sell-off accelerates, exposing 1.0920 as an important threshold to keep the euro afloat.
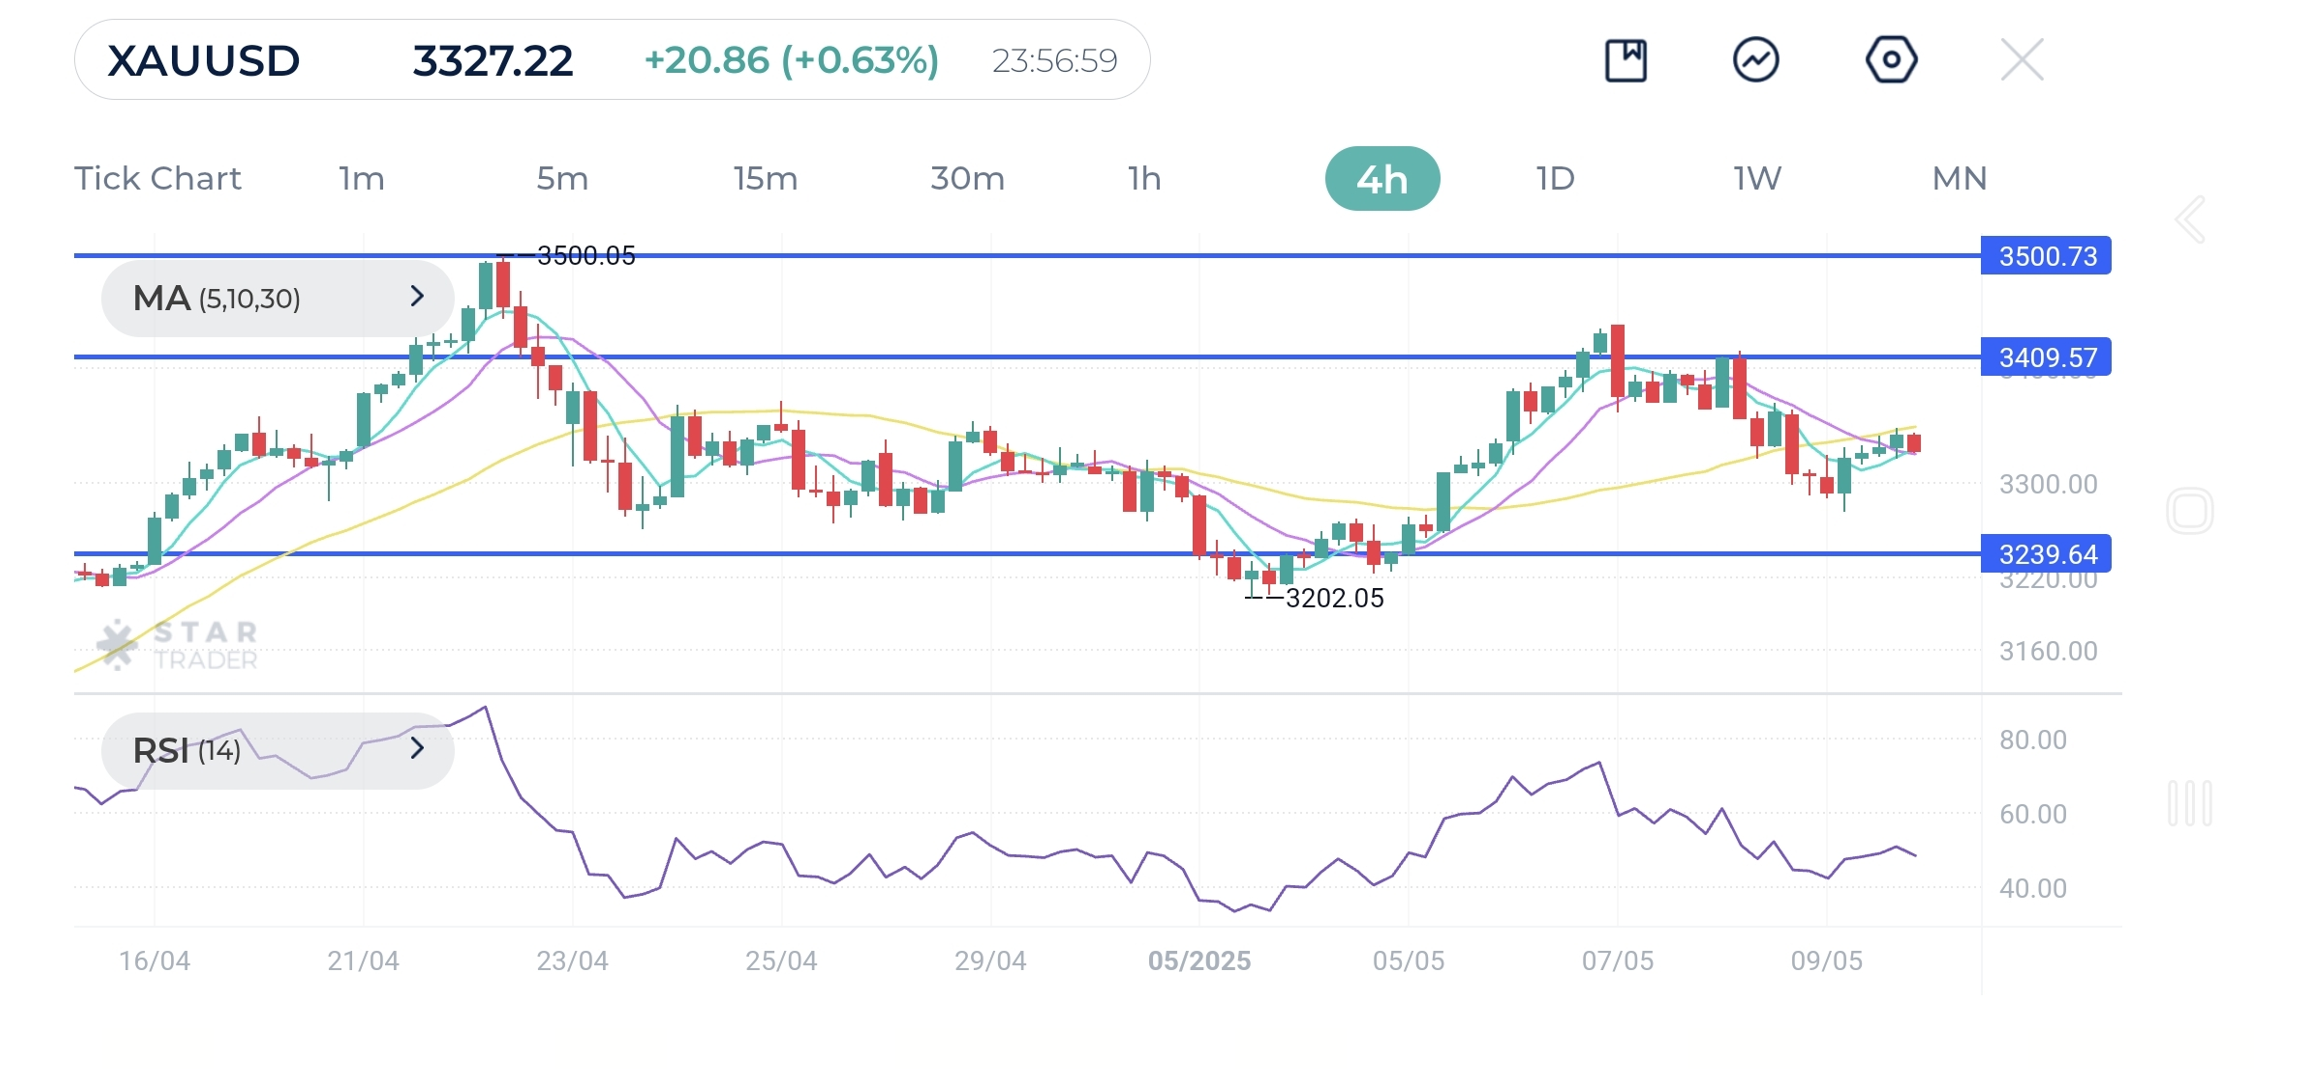
Gold has faced another rejection above the $3,405 level, marking the second failed attempt to hold gains in that zone. This indicates strong overhead resistance and waning short-term bullish momentum. However, the medium-term technical picture remains bullish. The price continues to trade above the 30-day SMA, suggesting that bulls still have control despite the recent pullback, and the broader uptrend remains intact. If selling pressure continues, the price could decline toward the $3,240 support, with the double bottom at $3,190 as the critical floor. On the upside, bulls must clear $3,410, which has capped recent advances, to attempt a new test of the $3,500 all-time high. Until a breakout occurs in either direction, trading may remain range-bound, but the bias favors the upside as long as price holds above said support levels.
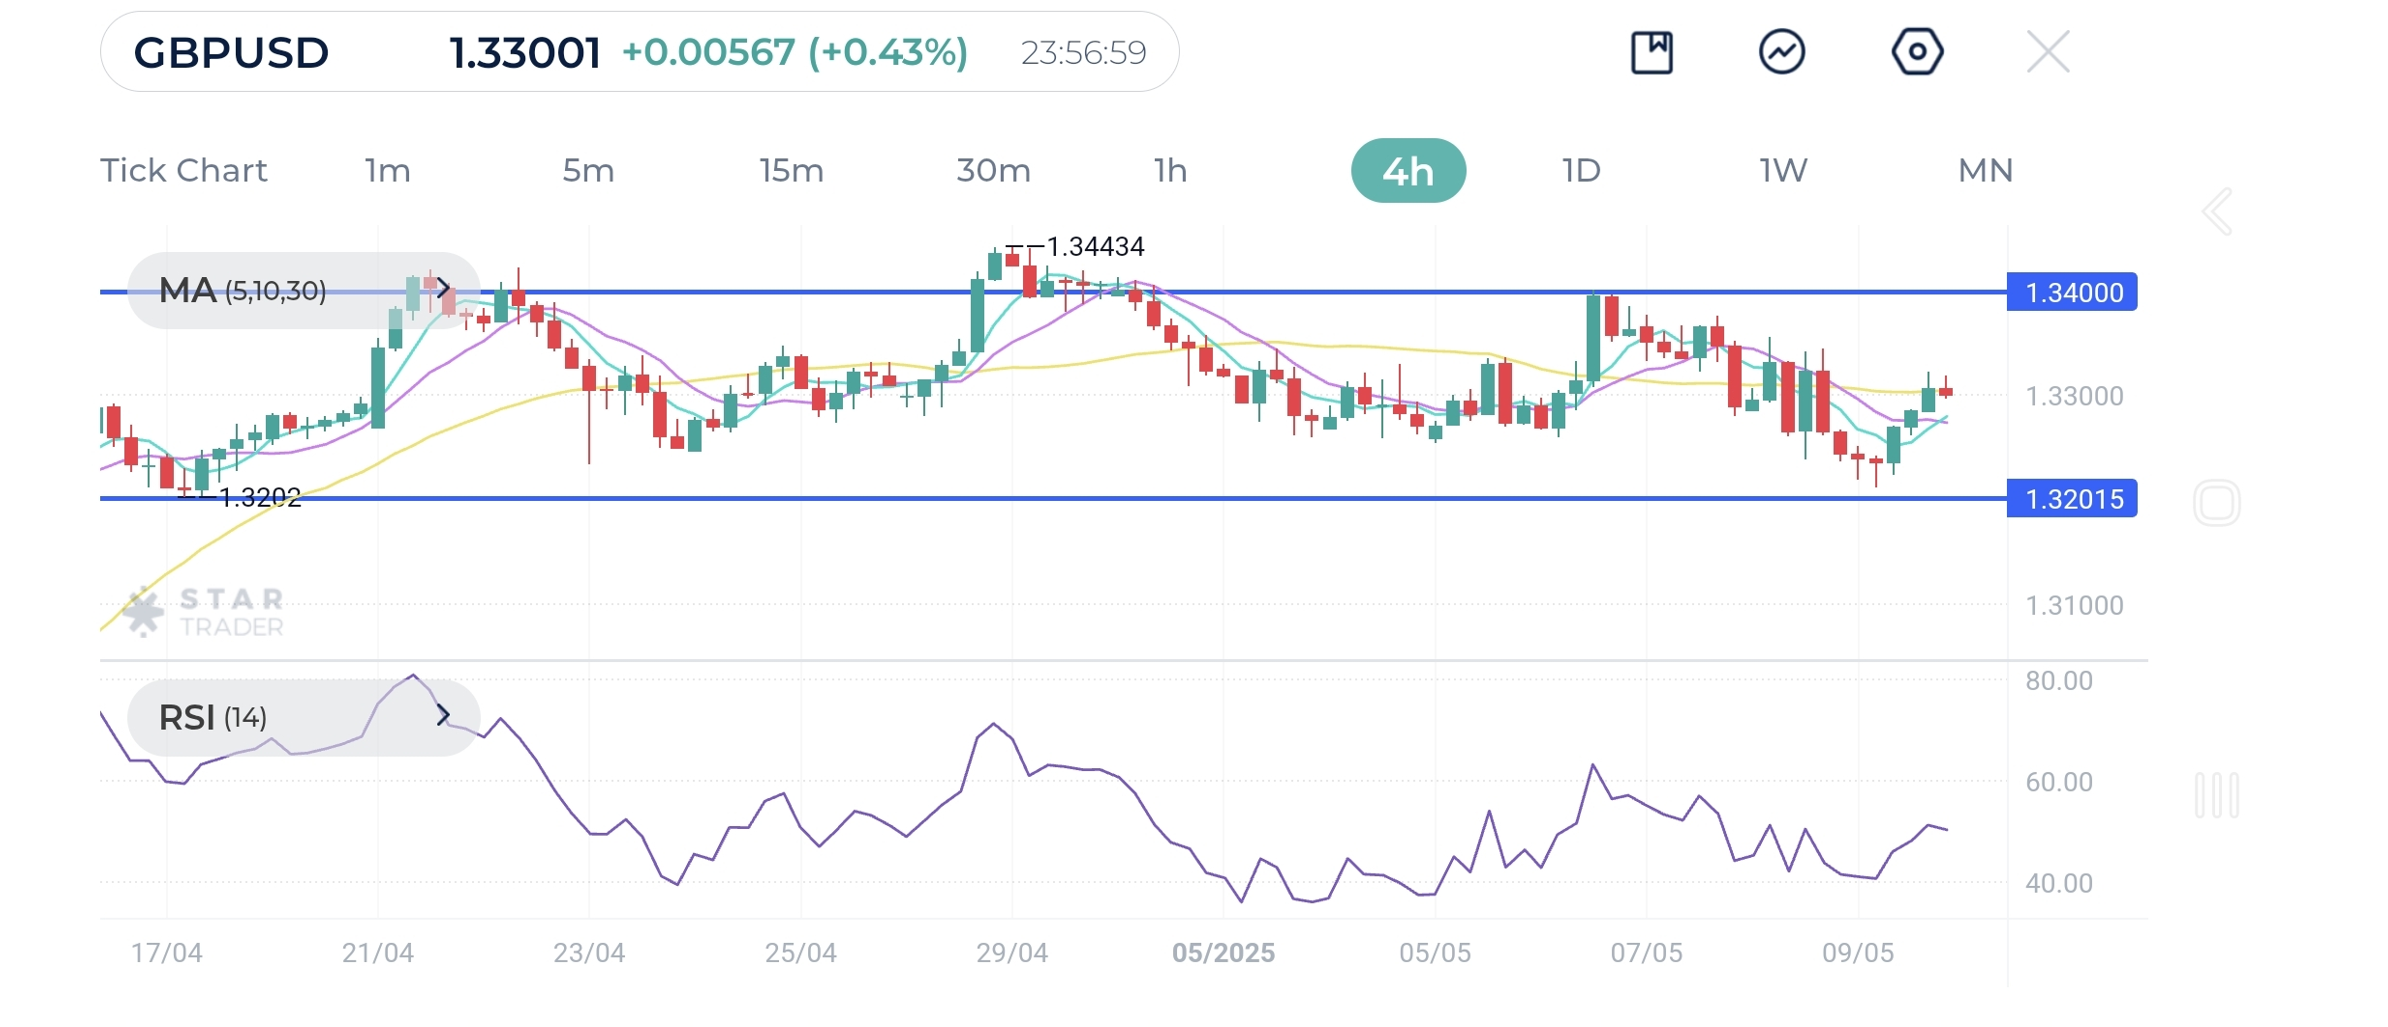
The 4-hour chart paints a mixed technical picture for GBP/USD as the pair is attempting a new low below 1.3260, but quickly reclaimed the level, hovering above the psychological level of 1.3200, signaling lingering weakness but no decisive bearish follow-through yet. The RSI has rebounded from oversold territory, hinting at a potential pullback. Its neutral attribute might attract more selling interest as buyers continue to take profit. 1.3200 coincides with the 30-day SMA, making it a crucial demand zone before bears could push lower. A breakout would open the path for a deeper retracement towards 1.29s. On the upside, 1.3400 is the hurdle to lift to help bulls regain control.
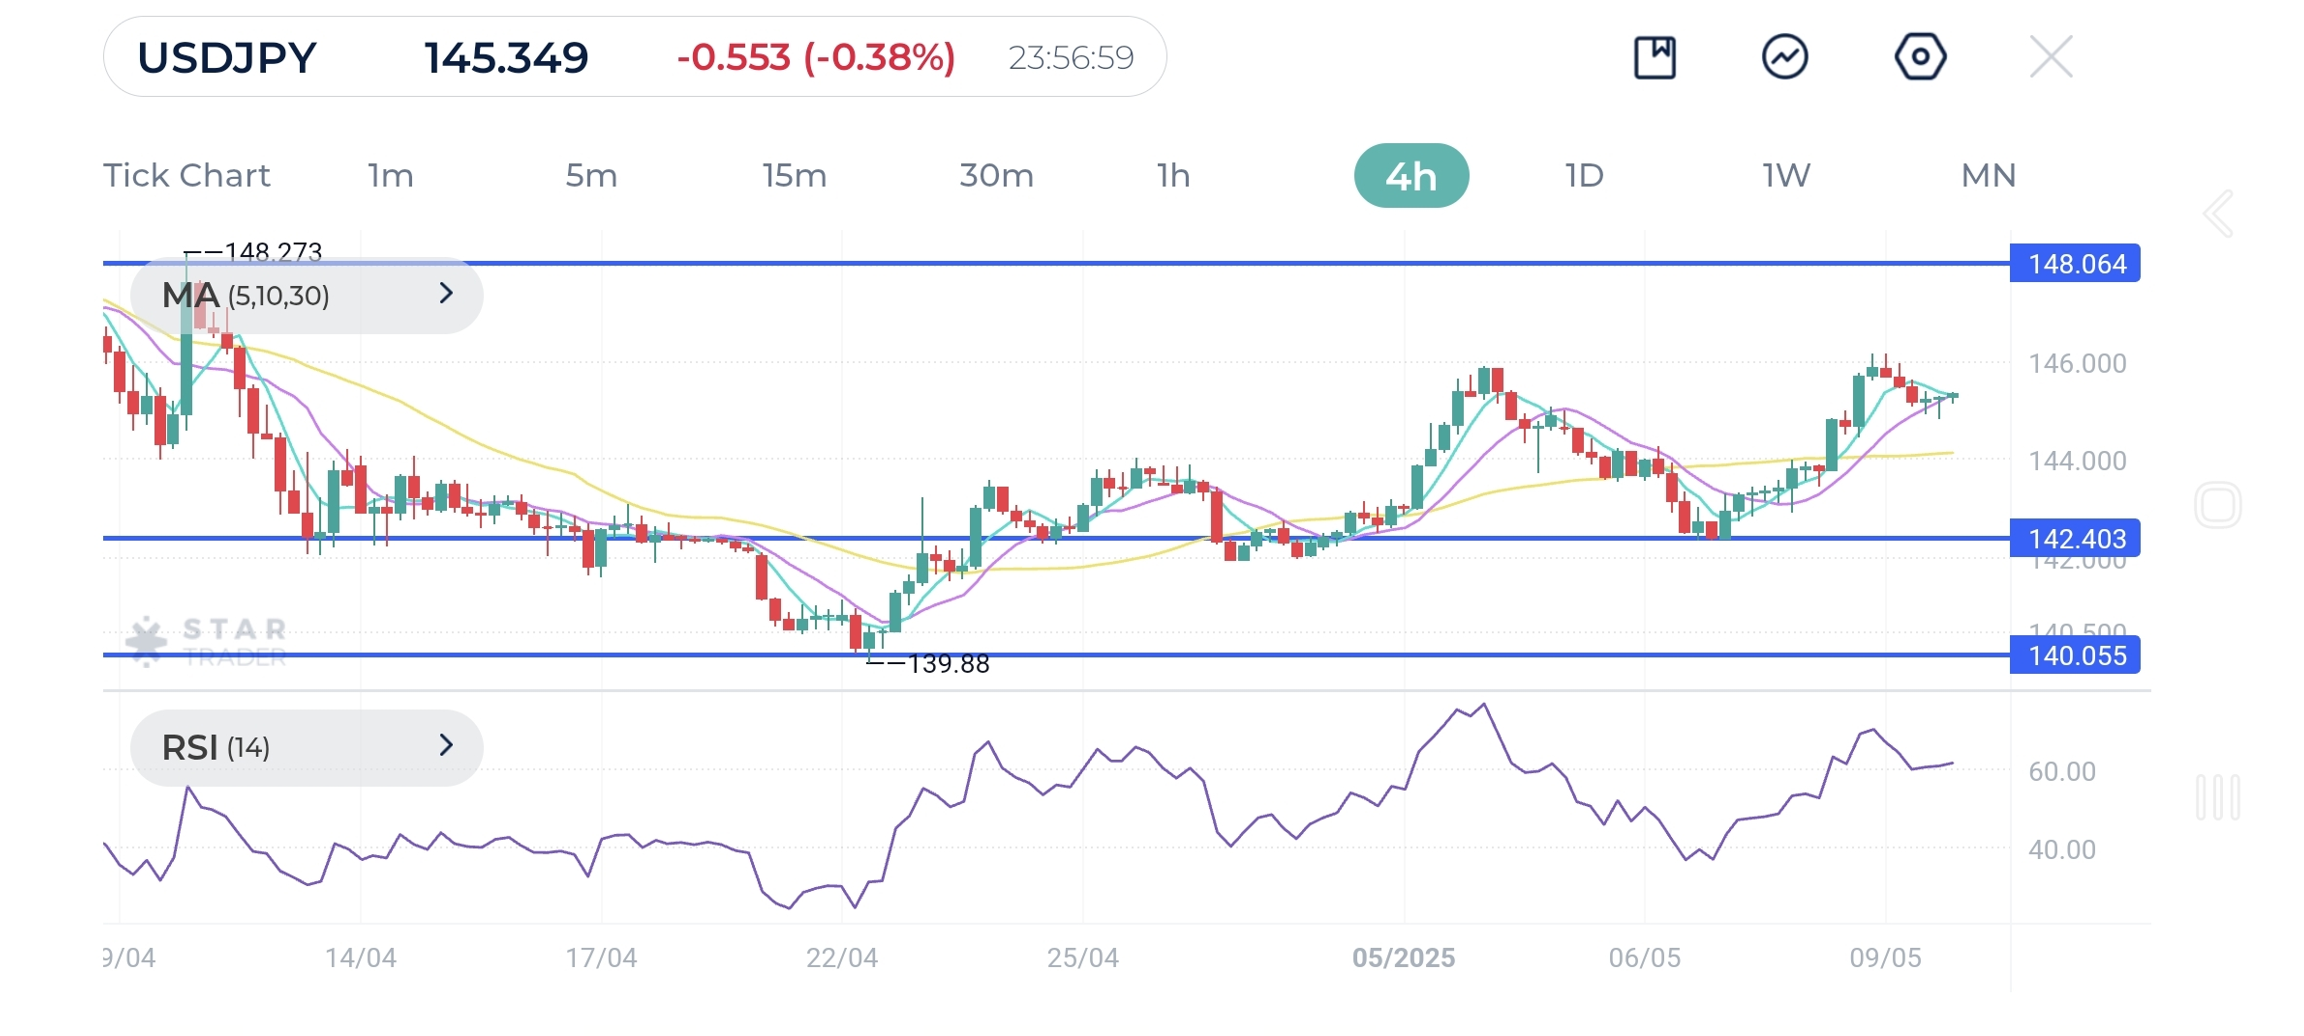
USD/JPY faces a critical test as it pulls back just after it broke above the downward-sloping 30-day SMA. The pair risks reversing its recent recovery from the triple bottom and the psychological level at 140.00 if it fails to hold within the key 141.70–142.40 zone. A break below this support region would shift focus toward the 140.00 area once again, where a breach would open the door to retest the two-year low next to 137.00. However, if USD/JPY manages to hold onto its recent gains, and climb above immediate resistance of 148.00, the pair may extend its rally with a series of higher highs and higher lows, setting the stage for a broader bullish extension.
Tags
Open Live Account
Please enter a valid country
No results found
No results found
Please enter a valid email
Please enter a valid verification code
1. 8-16 characters + numbers (0-9) 2. blend of letters (A-Z, a-z) 3. special characters (e.g, !a#S%^&)
Please enter the correct format
Please tick the checkbox to proceed
Please tick the checkbox to proceed
Important Notice
STARTRADER does not accept any applications from Australian residents.
To comply with regulatory requirements, clicking the button will redirect you to the STARTRADER website operated by STARTRADER PRIME GLOBAL PTY LTD (ABN 65 156 005 668), an authorized Australian Financial Services Licence holder (AFSL no. 421210) regulated by the Australian Securities and Investments Commission.
CONTINUEImportant Notice for Residents of the United Arab Emirates
In alignment with local regulatory requirements, individuals residing in the United Arab Emirates are requested to proceed via our dedicated regional platform at startrader.ae, which is operated by STARTRADER Global Financial Consultation & Financial Analysis L.L.C.. This entity is licensed by the UAE Securities and Commodities Authority (SCA) under License No. 20200000241, and is authorised to introduce financial services and promote financial products in the UAE.
Please click the "Continue" button below to be redirected.
CONTINUEError! Please try again.